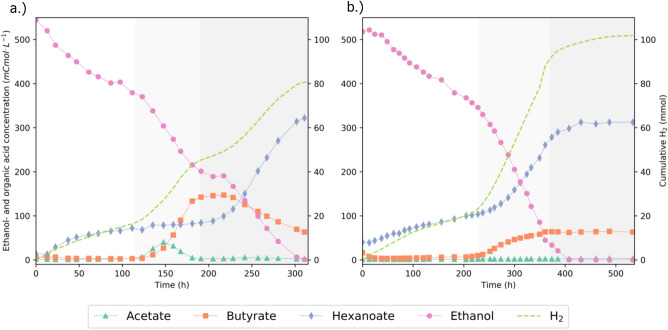
Figure 2.
Ethanol-only batch experiment replicate I (A) and II (B). The replicates show different biochemical conversion profiles of ethanol. 100 mL of an active chain-elongating culture was incubated in a batch bioreactor with 500 mCmol ethanol and no added SCCAs in duplicate. Different phases in the experiment are distinguished according to stoichiometric shifts and are indicated with different shades of background color. Solid lines are linear interpolations between the datapoints.

