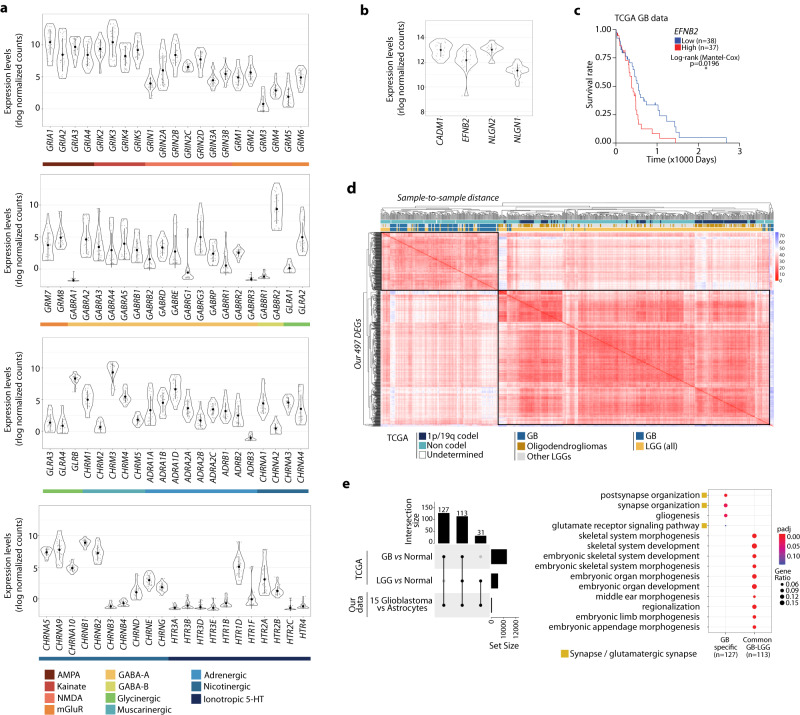
Fig. 2. Transcriptional changes reveal a gene signature that segregates GB from LGG.
a, b Expression of neurotransmitter receptor genes (a) and synaptogenesis markers (b) in the 15 GB lines (mean ± SD). c Kaplan–Meier survival curves plotted for patients stratified by quartiles of EFNB2 expression (TCGA data) (log-rank Mantel–Cox test, *p = 0.0196, low n = 38 and high n = 37). d Sample-to-sample distance for GB (glioblastoma, n = 156) or LGG (low-grade glioma, n = 511) tumours from TCGA based on the expression of our 497 DEGs. Annotations include 1p/19q codeletion and non codel (i.e., 1p/19q intact), as well as LGG oligodendrogliomas and other LGGs. e Intersections between our 497 DEGs and the differentially expressed genes from TCGA tumour samples, either GB vs normal or LGG vs normal tissue (left). Top 10 GO terms enriched in the 127 GB-specific genes or 113 genes common to GB and LGG (right) (p-value: hypergeometric test with Benjamini correction).

