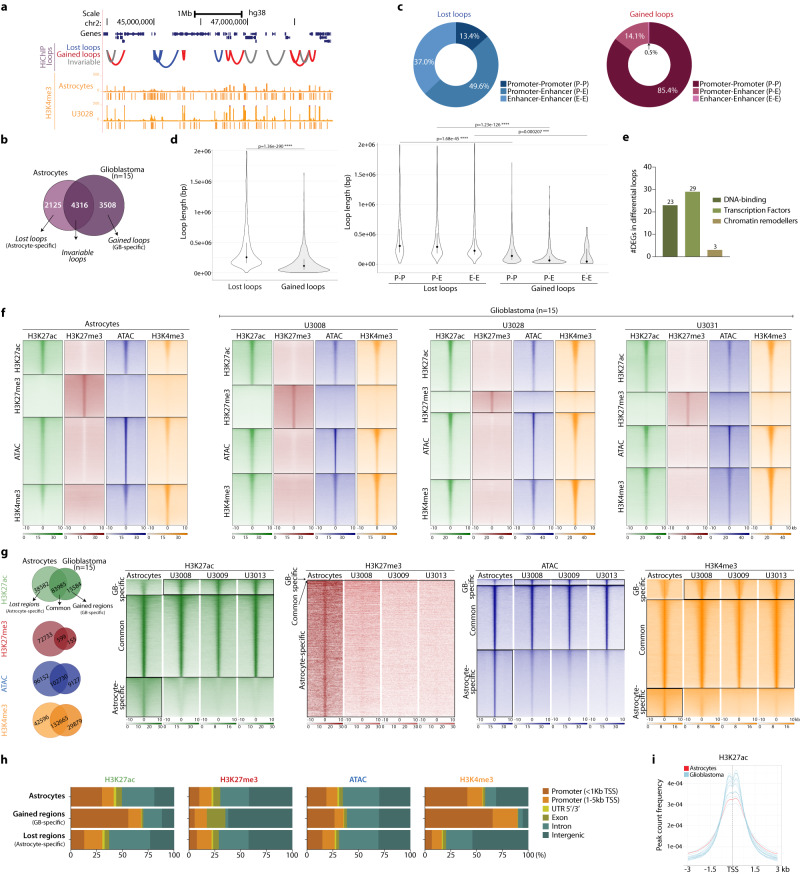
Fig. 3. Loss of long-range regulatory interactions and changes in the regulatory landscape in GB.
a Distribution of HiChIP loops and H3K4me3 peaks in a region of chromosome 2. b Intersection of HiChIP loops in the 14 GB lines and normal astrocytes defines lost loops (“astrocyte-specific”) and gained loops (“GB-specific”) in glioblastoma. c Annotation of lost and gained loops as P–P, P–E, or E–E loops. d Length (bp) of lost and gained loops (median, IQR; two-sided t-test with Benjamini correction; n = 2125 lost and n = 3508 gained loops). e Number of DEGs at the anchors of differential loops annotated as DNA-binding, transcription factors or chromatin remodellers. f Read distribution of histone marks and ATAC around the indicated ±10 kb regions in astrocytes and three representative GB lines. g Redistribution of histone marks and ATAC regions in GB. h Genomic annotation of differential histone peaks and ATAC regions in GB vs normal astrocytes. i H3K27ac peak count frequency around the TSSs. Source Data are provided as a Source Data file for Fig. 3c, d, e, h.

