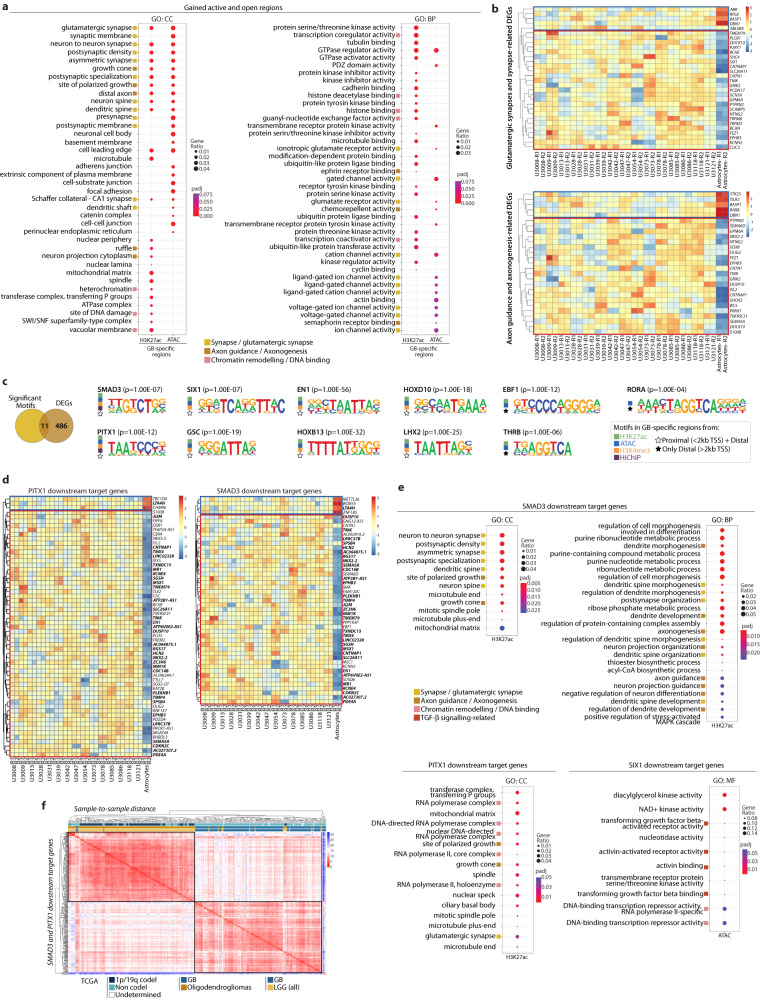
Fig. 5. SMAD3 and PITX1 regulatory networks control genes associated to (glutamatergic) synapse organization and axonogenesis in GB.
a Top 25 GO terms enriched for genes proximal to gained active and open regions in GB (peaks <2 kb TSS) (p-value: hypergeometric test with Benjamini correction). b Expression of DEGs related to synapse and glutamatergic synapse (top), and axon guidance and axonogenesis (bottom) located <2 kb from a gained active/open peak. c Intersection of the 497 DEGs with the HOMER significantly enriched motifs at the gained regions or anchors of differential loops identifies 11 key TFs (p-values: hypergeometric test). d Expression of PITX1 and SMAD3 downstream target genes (i.e., motif enrichment at a differential peak <2 kb TSS) among the DEGs in GB vs normal astrocytes (common targets in bold). e Top GO terms enriched for SMAD3, PITX1 and SIX1 proximal downstream target genes (p-value: hypergeometric test with Benjamini correction). f Sample-to-sample distance for GB (glioblastoma, n = 156) or LGG (low-grade glioma, n = 511) tumours from TCGA based on the expression of the SMAD3 and PITX1 downstream targets. Annotations include 1p/19q co-deletion and non codel (i.e., 1p/19q intact), as well as LGG oligodendrogliomas.

