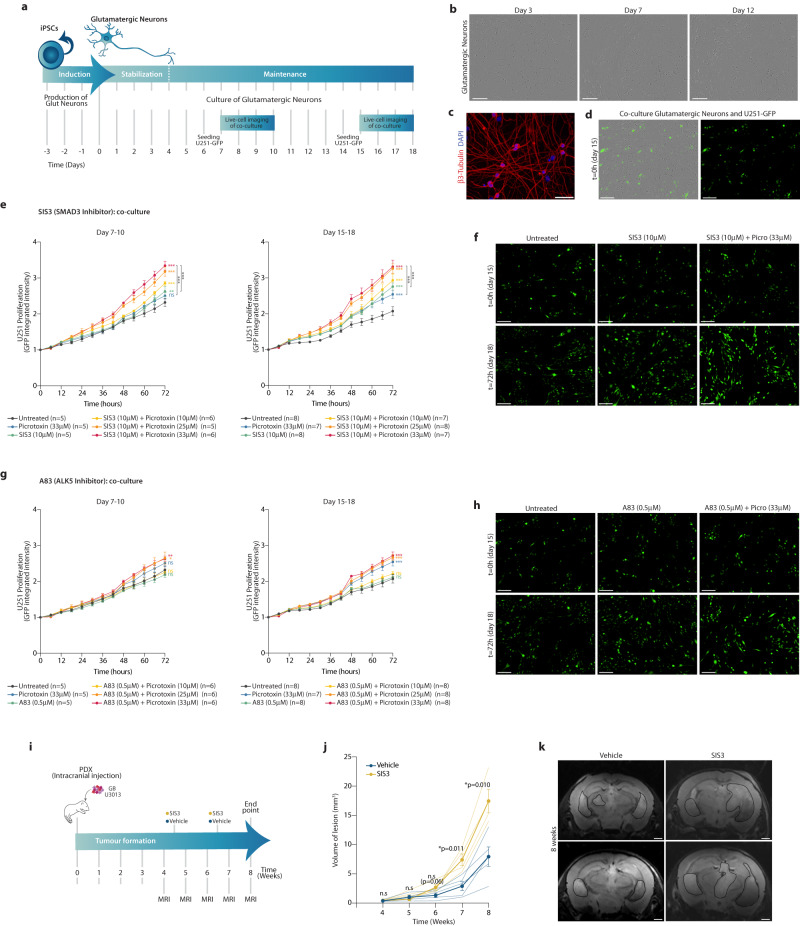
Fig. 7. SMAD3 inhibition and neuronal activity cooperate to promote proliferation of GB cells in co-culture with glutamatergic neurons and in vivo in mice.
a Workflow to reprogram glutamatergic neurons from iPSCs, establish a co-culture with GFP-labelled U251 GB cells and live-cell image acquisition. b Photomicrograph of glutamatergic neurons at days 3, 7 and 12. c Glutamatergic neurons stained with an antibody against β3-Tubulin (red) (DAPI, blue). d Photomicrographs of glutamatergic neurons and U251-GFP glioblastoma cells (green) in co-culture. e, g Proliferation curves depicting the growth of U251 cells (measured as normalized GFP integrated intensity) in co-culture with glutamatergic neurons in the 72 h after seeding at day 6 (left) or day 14 (right), while treated with either the SMAD3-specific inhibitor SIS3 (e) or the ALK5 inhibitor A83 (g), in combination with increasing concentrations of picrotoxin (mean ± SEM, multiple unpaired two-sided t-test, t = 72 h, * p < 0.01, ** p < 0.005, *** p < 0.000005, exact p-values in Source Data file) [(e, left) n = 5 in U, P33, S10, S10 + P25 and n = 6 in S10 + P10, S10 + P33; (e, right) n = 8 in U, S10, S10 + P25 and n = 7 in P33, S10 + P10, S10 + P33; (g, left) n = 5 in U, P33, A0.5 and n = 6 in A0.5 + P10, A0.5 + P25, A0.5 + P33; (g, right) n = 8 in U, A0.5, A0.5 + P10, A0.5 + P25, A0.5 + P33 and n = 7 in P33; where U, P, S and A denote untreated, picrotoxin, SIS3 and A83, respectively, and the numbers indicate μM concentration]. f, h Representative images from the live-cell imaging proliferation assay of U251-GFP cells in co-culture with glutamatergic neurons, in the presence of either SIS3 (f) or A83 (h). i Timeline of longitudinal study to follow tumour progression in vivo in mice carrying PDXs (patient-derived xenografts) and treated with either the SMAD3 inhibitor SIS3 or vehicle. j Volume of pathological lesions measured weekly by MRI from t = 4 to t = 8 weeks in SIS3- or vehicle-treated mice (n = 4 and n = 5 respectively; mean ± SEM, two-sided Mann Whitney test). k Representative MRI images of SIS3- or vehicle-treated mice at t = 8 weeks. Scale bars: 200 μm (b, d, f, h), 50 μm (c), 1 mm (k). Source Data are provided as a Source Data file for Fig. 7e, g, j.

