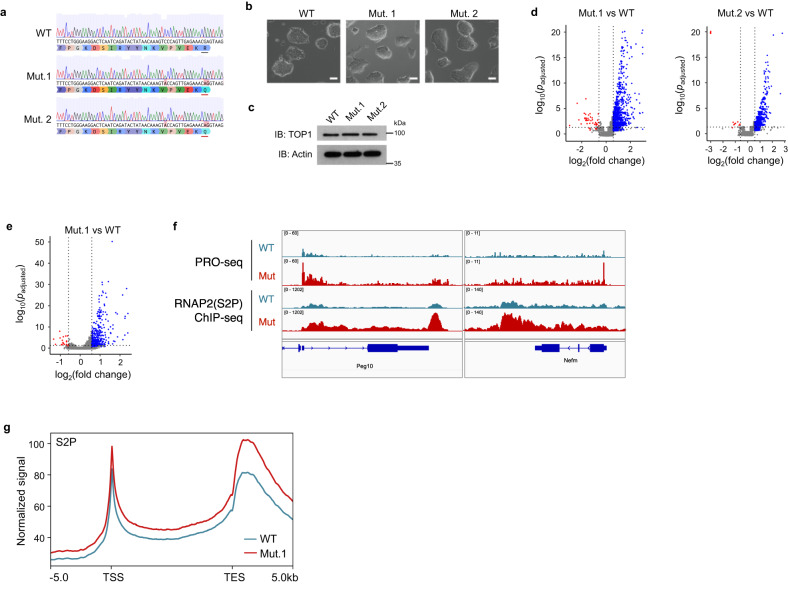
Fig. 2. Endogenous mutation of secondary DNA binding site leads to hypertranscription in mESCs.
a Sanger sequencing traces of a portion of exon15 of Top1 in mutant and wildtype mESCs; R548Q substitutions are underlined in red. b Bright field images of mESC colonies. Scale bars: 20 µm. c Western blot of lysates obtained from equal number of cells. Actin was used as loading control. d, e Volcano plots of RNA-seq (d) and PRO-seq (e) analyses. Red and blue indicated down- and up-regulated DEGs, as determined using DESeq2 (see details in ‘Methods’). f Genome browser screenshot of PRO-seq and elongating RNAP2 (‘S2P’) ChIP-seq signals over representative genes. Only PRO-seq signals in the transcribing directions are shown. g Metaplot of ChIP-seq signals of elongating RNAP2(S2P) over all genes.

