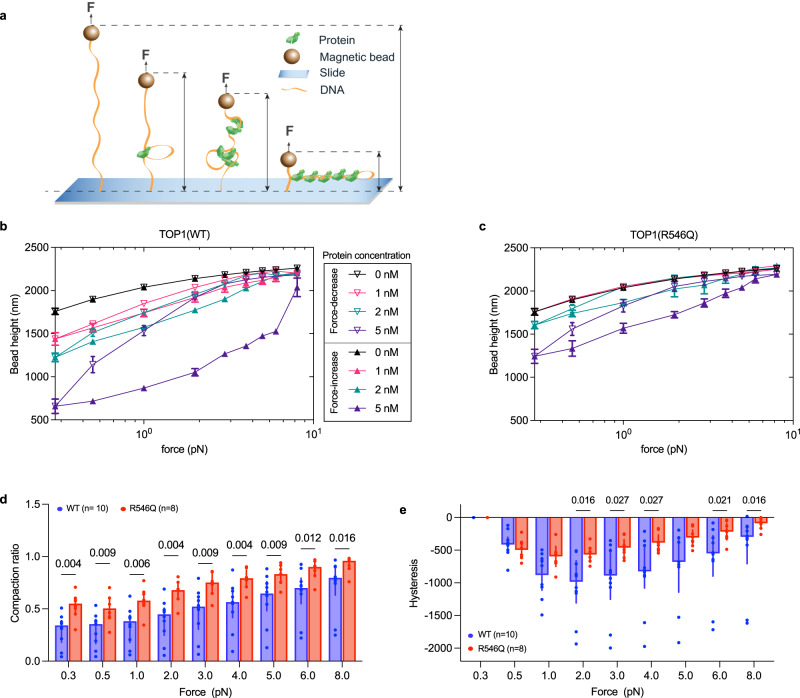
Fig. 5. Mutation impairs TOP1’s ability to induce and stabilize binding-dependent DNA structural change.
a Schematic representation of DNA tether held under stretching force, F, in a magnetic tweezer experiment setup. The provided illustrations showcase potential conformational changes in DNA that may occur following TOP1 protein binding. ε denotes DNA extension, which decreases as DNA is compacted by protein binding. b, c Representative force-height curves obtained from a DNA tether in a force-decrease scan (hollow symbols) followed by a force-increase scan (solid symbols) at various concentrations of TOP1(WT) (b) and TOP1(R546Q) (c). Data represented are mean ± SD of DNA extension fluctuations during the recording time window. Source data are provided as a Source Data file. d Compaction ratio of DNA tether when incubated with 5 nM TOP1 protein. n = 10 (WT), n = 8 (R546Q) independent DNA tethers. Bar height represent median, error bars represent interquartile range. Mann–Whitney test was used for comparing the two groups; p values (two-tailed) are indicated above the comparisons. Source data are provided as a Source data file. e Hysteresis, which is calculated by subtracting extension in force-decrease scan from extension in force-increase scan, in DNA tethers when incubated with 5 nM TOP1 protein. n = 10 (WT), n = 8 (R546Q) independent DNA tethers. Bar height represent median, error bars represent interquartile range. Mann–Whitney test was used for comparing the two groups; only p values (two-tailed) <0.05 are shown above the comparisons. Source data and other p values are provided in Source data file.

