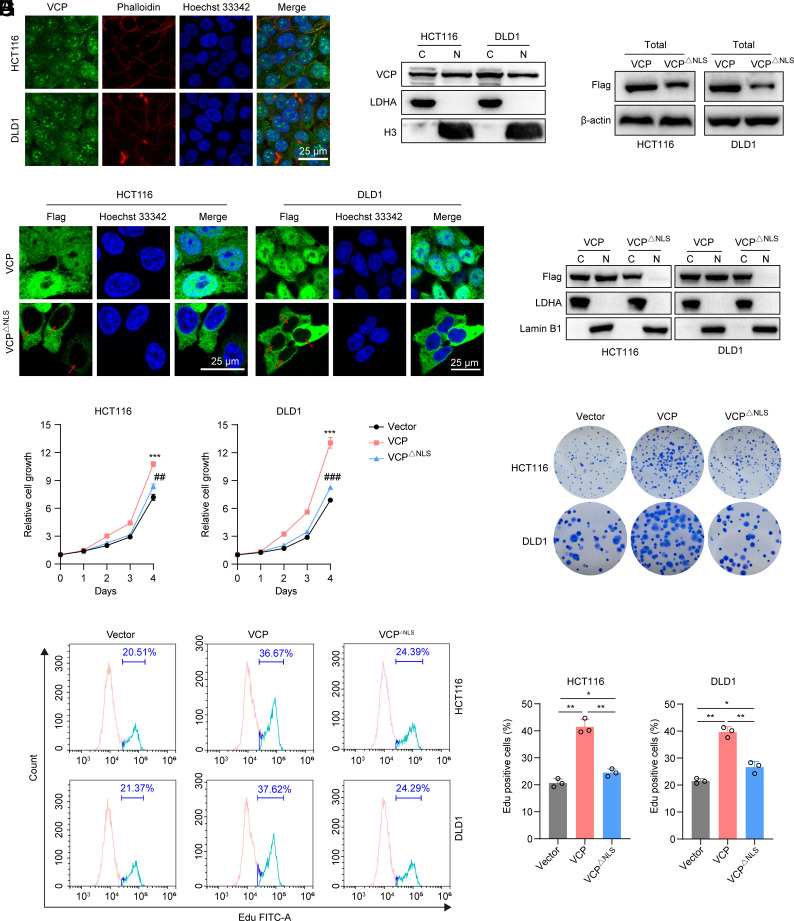
Fig. 1.
Nuclear VCP promotes CRC growth. (A) Immunofluorescent staining of VCP (green) in HCT116 and DLD1 cells. The cytoplasm was stained with phalloidin (red), and nuclei were stained with Hoechst 33342 (blue) (Scale bar, 25 μm). (B) Western blot analysis assessing the distribution of VCP in the cytosolic (C) and nuclear (N) fractions. LDHA and H3 were used as cytoplasmic and nuclear markers, respectively. (C) Western blot analysis of Flag-VCP in cells stably expressing Flag-tagged VCP or VCP△NLS. (D) Immunofluorescent staining for Flag (green) and Hoechst 33342 (blue) in cells stably expressing Flag-tagged VCP or VCP△NLS. Red arrows depict the nuclear VCP localization (Scale bar, 25 μm). (E) Western blot analysis of Flag-VCP in the cytosolic and nuclear fractions of the indicated cells stably expressing Flag-tagged VCP or VCP△NLS. LDHA and Lamin B1 were used as cytoplasmic and nuclear markers, respectively. (F) The relative growth of HCT116 and DLD1 cells stably expressing VCP, VCP△NLS, or control vector, n = 3. *: VCP versus vector at day 4, #: VCP△NLS versus VCP at day 4. (G) Colony formation assay of HCT116 and DLD1 cells stably expressing VCP, VCP△NLS, or control vector, n = 3. (H and I) Flow cytometry analysis of EdU incorporation and PI staining of cells stably expressing VCP, VCP△NLS, or control vector. (I) EdU-positive cells were quantified, n = 3. Data represent the mean ± SD. *P < 0.05, **P or ##P < 0.01, ***P or ###P < 0.001. P values were determined by one-way ANOVA. See also SI Appendix, Figs. S1 and S2.

