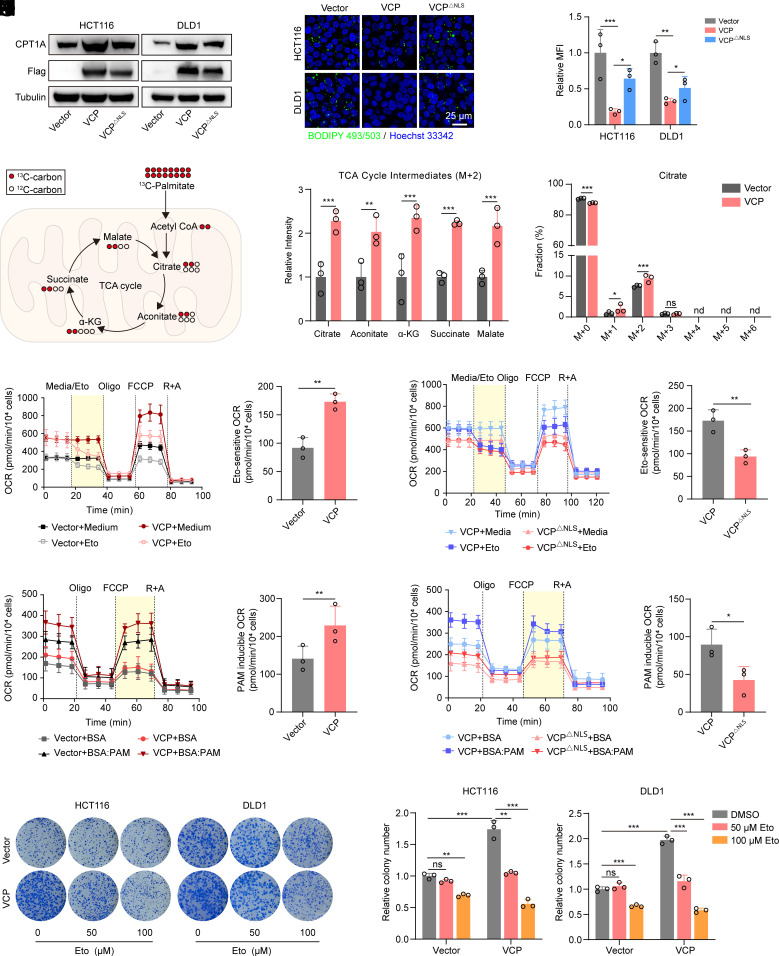
Fig. 3.
Nuclear VCP promotes FAO in CRC. (A) Western blot analysis of CPT1A and Flag-VCP in cells stably expressing Flag-tagged VCP, VCP△NLS, or control vector. (B and C) BIODIPY 493/503 staining was used to determine the content of lipid droplets in cells stably expressing VCP, VCP△NLS, or control vector (Scale bar, 25 μm). (C) The mean fluorescence intensity (MFI) was quantified, n = 3. (D and E) Metabolic tracing analysis of 13C-labeled palmitate in HCT116 cells stably expressing VCP or control vector. (E) The relative intensity of M + 2 citrate and other indicated TCA metabolites (Left), as well as the fraction of each isotopomer for the citrate pool (Right), is shown, n = 3. (F–I) OCR were measured at baseline and in response to media, etomoxir (Eto), oligomycin (Oligo), FCCP, and rotenone plus antimycin A (R + A) in vector-/VCP-expressed HCT116 cells (F and G) and VCP-/VCP△NLS-expressed HCT116 cells (H and I). Eto-sensitive OCR (yellow areas) was quantified. Eto-sensitive OCR = OCR (Medium) -OCR (Eto), n = 3. (J–M) OCR of HCT116 cells, stably expressing vector or VCP (J and K) and stably expressing VCP or VCP△NLS (L and M) in response to palmitate (PAM)-containing medium. PAM-induced OCR (yellow areas) was quantified. PAM-induced OCR = OCR (BSA:PAM) − OCR (BSA), n = 3. (N and O) Colony formation assay of HCT116 and DLD1 cells stably expressing VCP or control vector after treatment with the indicated concentrations of etomoxir (Eto). (O) Colony number was quantified, n = 3. Data for (F), (H), (J), and (L) represent one of three independent experiments each contain three replicates. Data represent the mean ± SD. ns: not significant, nd: not detected, *P < 0.05; **P < 0.01; ***P < 0.001. P values were determined by Student’s t test for (E, G, I, K and M), one-way ANOVA for (C) or two-way ANOVA for (O). See also SI Appendix, Fig. S4.

