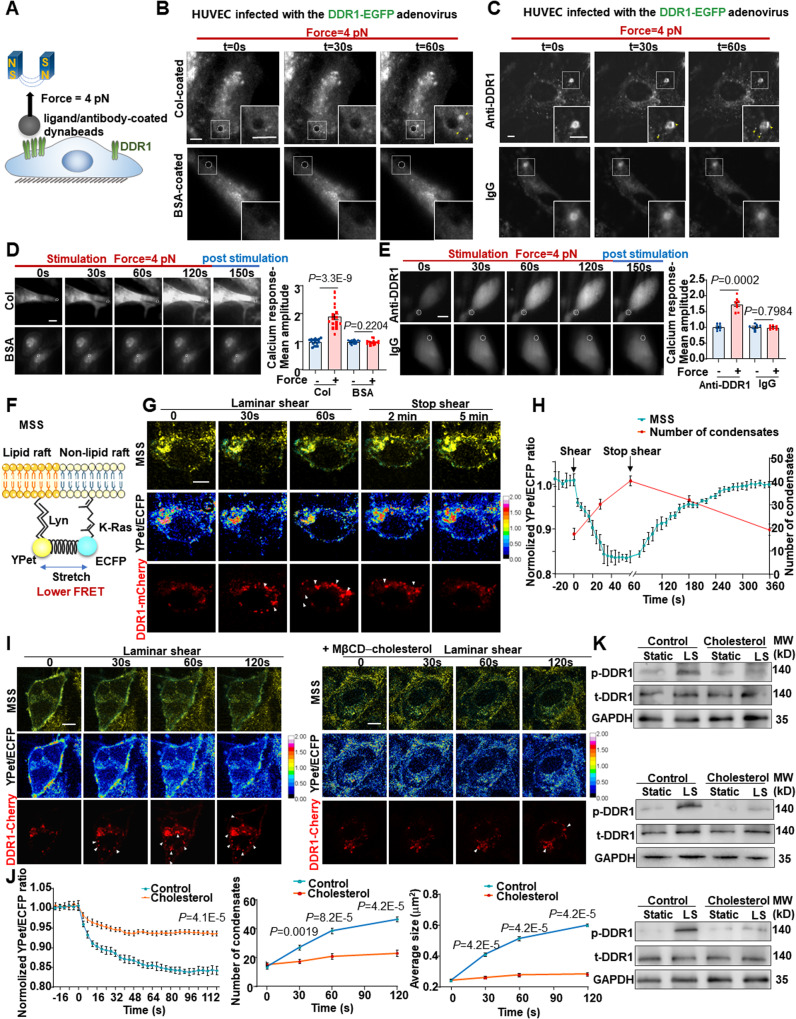
Fig. 3. DDR1 is a mechanosensor in endothelial cells.
A Schematic diagram of the magnetic tweezers assay. B, C Images of DDR1 condensates formation (yellow arrows) captured by total internal reflection fluorescence microscopy. HUVECs were infected with DDR1 adenovirus and incubated with collagen/ BSA-coated beads in (B), and incubated with anti-DDR1/IgG-coated beads in (C). Representative images of HUVECs loaded with Fluo-4AM dye and then incubated with collagen/ BSA-coated beads in (D), and anti-DDR1/IgG-coated beads in (E). Calcium responses were measured by calculating the fluorescent intensity of individual cells before (10 s), during (120 s), and after (30 s) stimulation. The position of dynabeads is indicated by white dashed circles. n = 16 cells from 4 biological replicates in (D). n = 8 cells from 4 biological replicates in (E). F Schematic diagram of a membrane-bound tension biosensor (MSS). MSS consists of a tension sensor module, which comprising an elastic spider silk protein inserted between ECFP and YPet, and two anchoring proteins. G The representative living cell images of YPet/ECFP emission ratio and DDR1-Cherry in EA.hy926 ECs subjected to laminar shear stress for 1 min and post-shear for 5 min. DDR1 droplets were indicated by white arrows. H The average time courses of FRET biosensors and quantification of number of DDR1 condensates in EA.hy926 ECs exposed to laminar shear stress. n = 9 biological replicates. I The representative living cell images of YPet/ECFP emission ratio and DDR1-Cherry in EA.hy926 ECs pretreated without or with cholesterol in complex with methyl-β-cyclodextrin (MβCD) (+MβCD-cholesterol). DDR1 droplets were indicated by white arrows. J Left: the average time courses of FRET biosensors in (I). Middle: quantification of number of DDR1 condensates in (I). Right: quantification of average condensate size in (I). n = 9 biological replicates. In (D, E and J), Data were all analyzed by two-sided Mann–Whitney test. K Western blotting to assess DDR1 phosphorylation in HUVECs subjected to laminar shear stress for 1 h or static. 3 biological replicates were presented. Data were all expressed as the means ± SEM. In (B, C), Scale bars, 5 μm. In (D, E, G and I), Scale bars, 10 μm.

