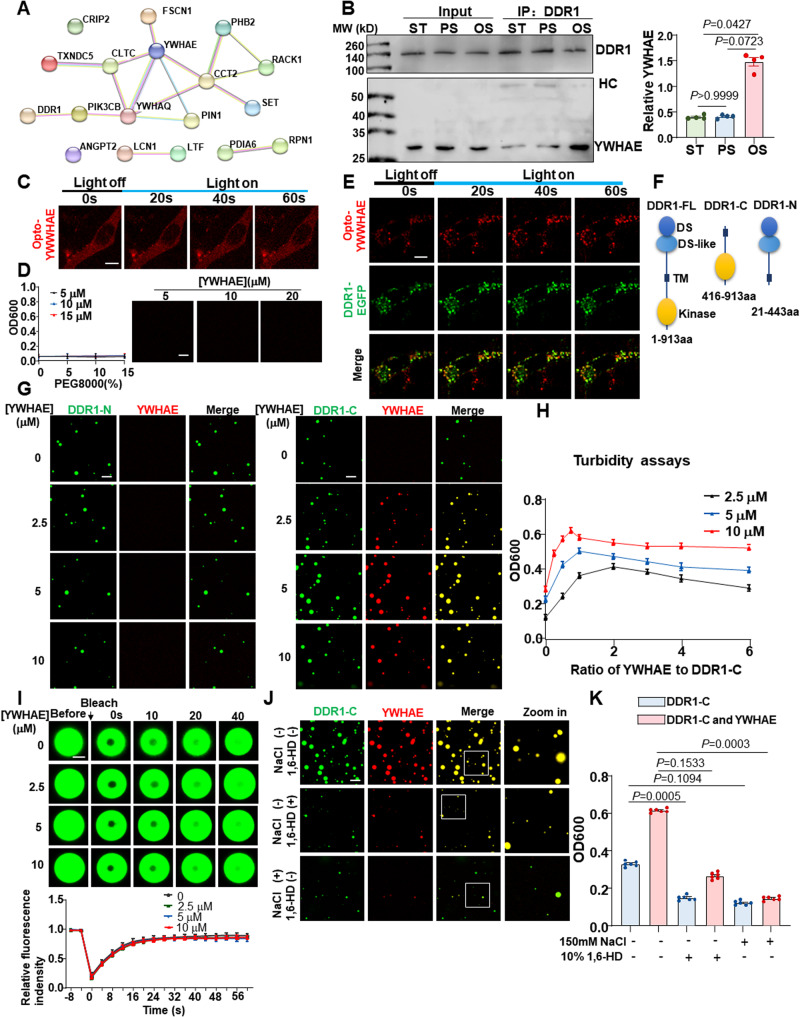
Fig. 5. Shear stress induces the association of YWHAE with DDR1 to regulate DDR1 phase separation.
A Protein-Protein interaction analysis of the IP-MS identified proteins. B Left: Co-IP between DDR1 and YWHAE in HUVECs cultured under the static condition or subjected to PS or OS for 3 h. IP was performed with anti-DDR1 antibody. HC: Heavy chain. Right: quantification of YWHAE immunoprecipitated with DDR1. n = 4 biological replicates. Data were expressed as the means ± SEM and analyzed by Kruskal–Wallis test with Dunn’s test. C Representative images of NIH3T3 cells expressing Opto-YWHAE. Scale bar, 10 μm. D Left: turbidity of YWHAE solution at different concentrations. Data were expressed as the means ± SD. n = 5 biological replicates. Right: representative fluorescence microscopy images of YWHAE solution at different concentrations. Scale bar, 10 μm. E Representative images of NIH3T3 cells expressing both Opto-YWHAE and DDR1-EGFP. Scale bar, 10 μm. F Schematic representations of full-length DDR1 (DDR1-FL), 416-913aa of DDR1 (DDR1-C) and 21-443aa of DDR1 (DDR1-N). G Cell-free phase separation assay showing droplet formation of YWHAE-Cherry with DDR1 (416-913aa)-EGFP (DDR1-C, 5 μM) or DDR1 (21-443aa)-EGFP (DDR1-N, 5 μM) in indicated concentrations. Scale bar, 10 μm. In (C, E, and G), experiments were repeated 3 times independently with similar results. H Turbidity assays of LLPS of DDR1 (416-913aa)-EGFP at different concentrations and YWHAE/DDR1 molar ratio. Data were expressed as the means ± SEM. n = 5 biological replicates. I Up: representative fluorescence microscopy images of DDR1 droplets with different YWHAE concentrations. Down: quantification of fluorescent intensity of the area indicated by the dashed circle after FRAP experiment. n = 6 biological replicates. Data were expressed as the means ± SD. Scale bar, 1 μm. J Representative fluorescence microscopy images of droplets formed by DDR1 with YWHAE in the presence of 1,6-HD or 150 mM NaCl. Scale bar, 10 μm. K Turbidity of DDR1 and DDR1/YWHAE in the presence of 1,6-HD or 150 mM NaCl. n = 6 biological replicates. Data were expressed as the means ± SEM and analyzed by Kruskal–Wallis test with Dunn’s test.

