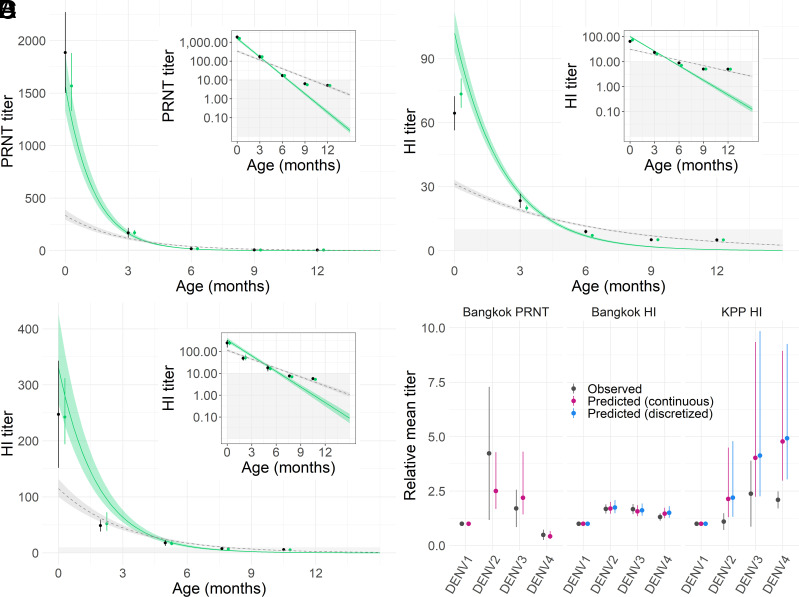
Fig. 2.
Observed and predicted population DENV antibody titers in infants. Panels A–C show model-reconstructed infant population DENV titers for the Bangkok (A and B) and Kamphaeng Phet (C) cohorts. The black points and lines show the mean and 95% CI of observed infant titers by age. Green points and vertical lines show model median and 95% CrI estimates of mean infant titers by age, where estimated titers were transformed to match the discretized measurement process and lower limit of detection truncation. The green lines and shaded ribbons represent the median and 95% CrI estimates of the underlying continuous-scale population mean DENV titers. Gray dashed lines and shaded ribbons show the median and 95% CrI estimates of population mean DENV titers using the “naive” cohort model, where the discretized measurement process and lower limits of assay detection are not accounted for. The Insets in panels A–C show the same model fits using a log-linear scale for antibody titers. Grey shaded regions represent titer values below the assay limits of detection. The mean titer of each serotype, relative to DENV1, by cohort and assay are shown in panel D where the black points and lines show the observed mean and 95% CI, and colored points and lines represent the model median and 95% CrI estimates.

