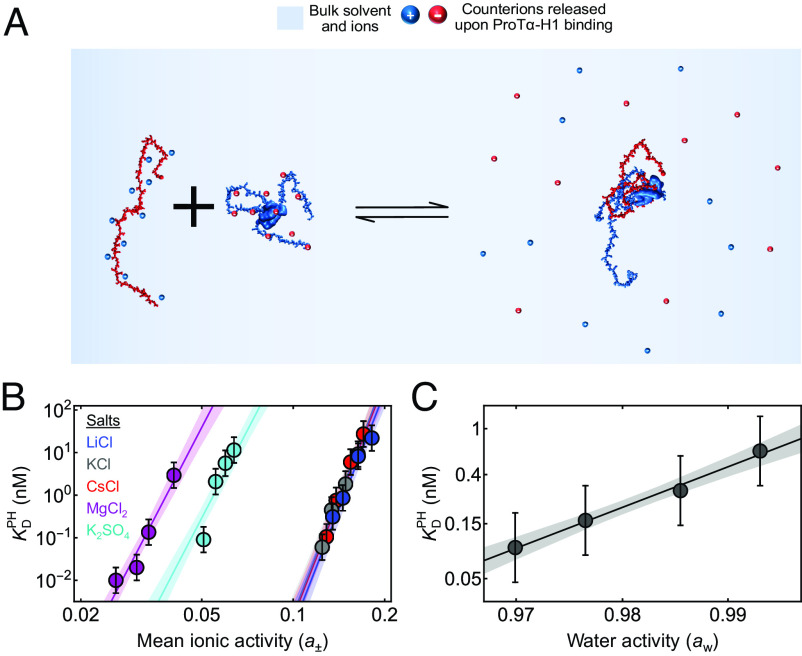
Fig. 2.
Effects of ion and water activities on ProTα-H1 binding. (A) Schematic of ProTα binding to H1 associated with counterion release. (B) Equilibrium dissociation constant for ProTα-H1 binding, , at different mean ionic activities (a±) of various salts (see the legend for color code). The data are fitted globally to obtain the number of monovalent and/or divalent ions released upon ProTα-H1 complex formation (see SI Appendix for details). The solid lines represent the fit, and the shaded regions represent 90% CIs. (C) at 208 mM monovalent salt concentration as a function of water activity (aw), varied by changing the concentration of the osmolyte triethylene glycol (SI Appendix). The solid line represents a fit with Eq. 4 for estimating the apparent number of water molecules released upon ProTα-H1 complex formation (shaded band: 90% CI). All error bars represent a conservative systematic error of a factor of 2 on KD (SI Appendix).

