Fig. 4.

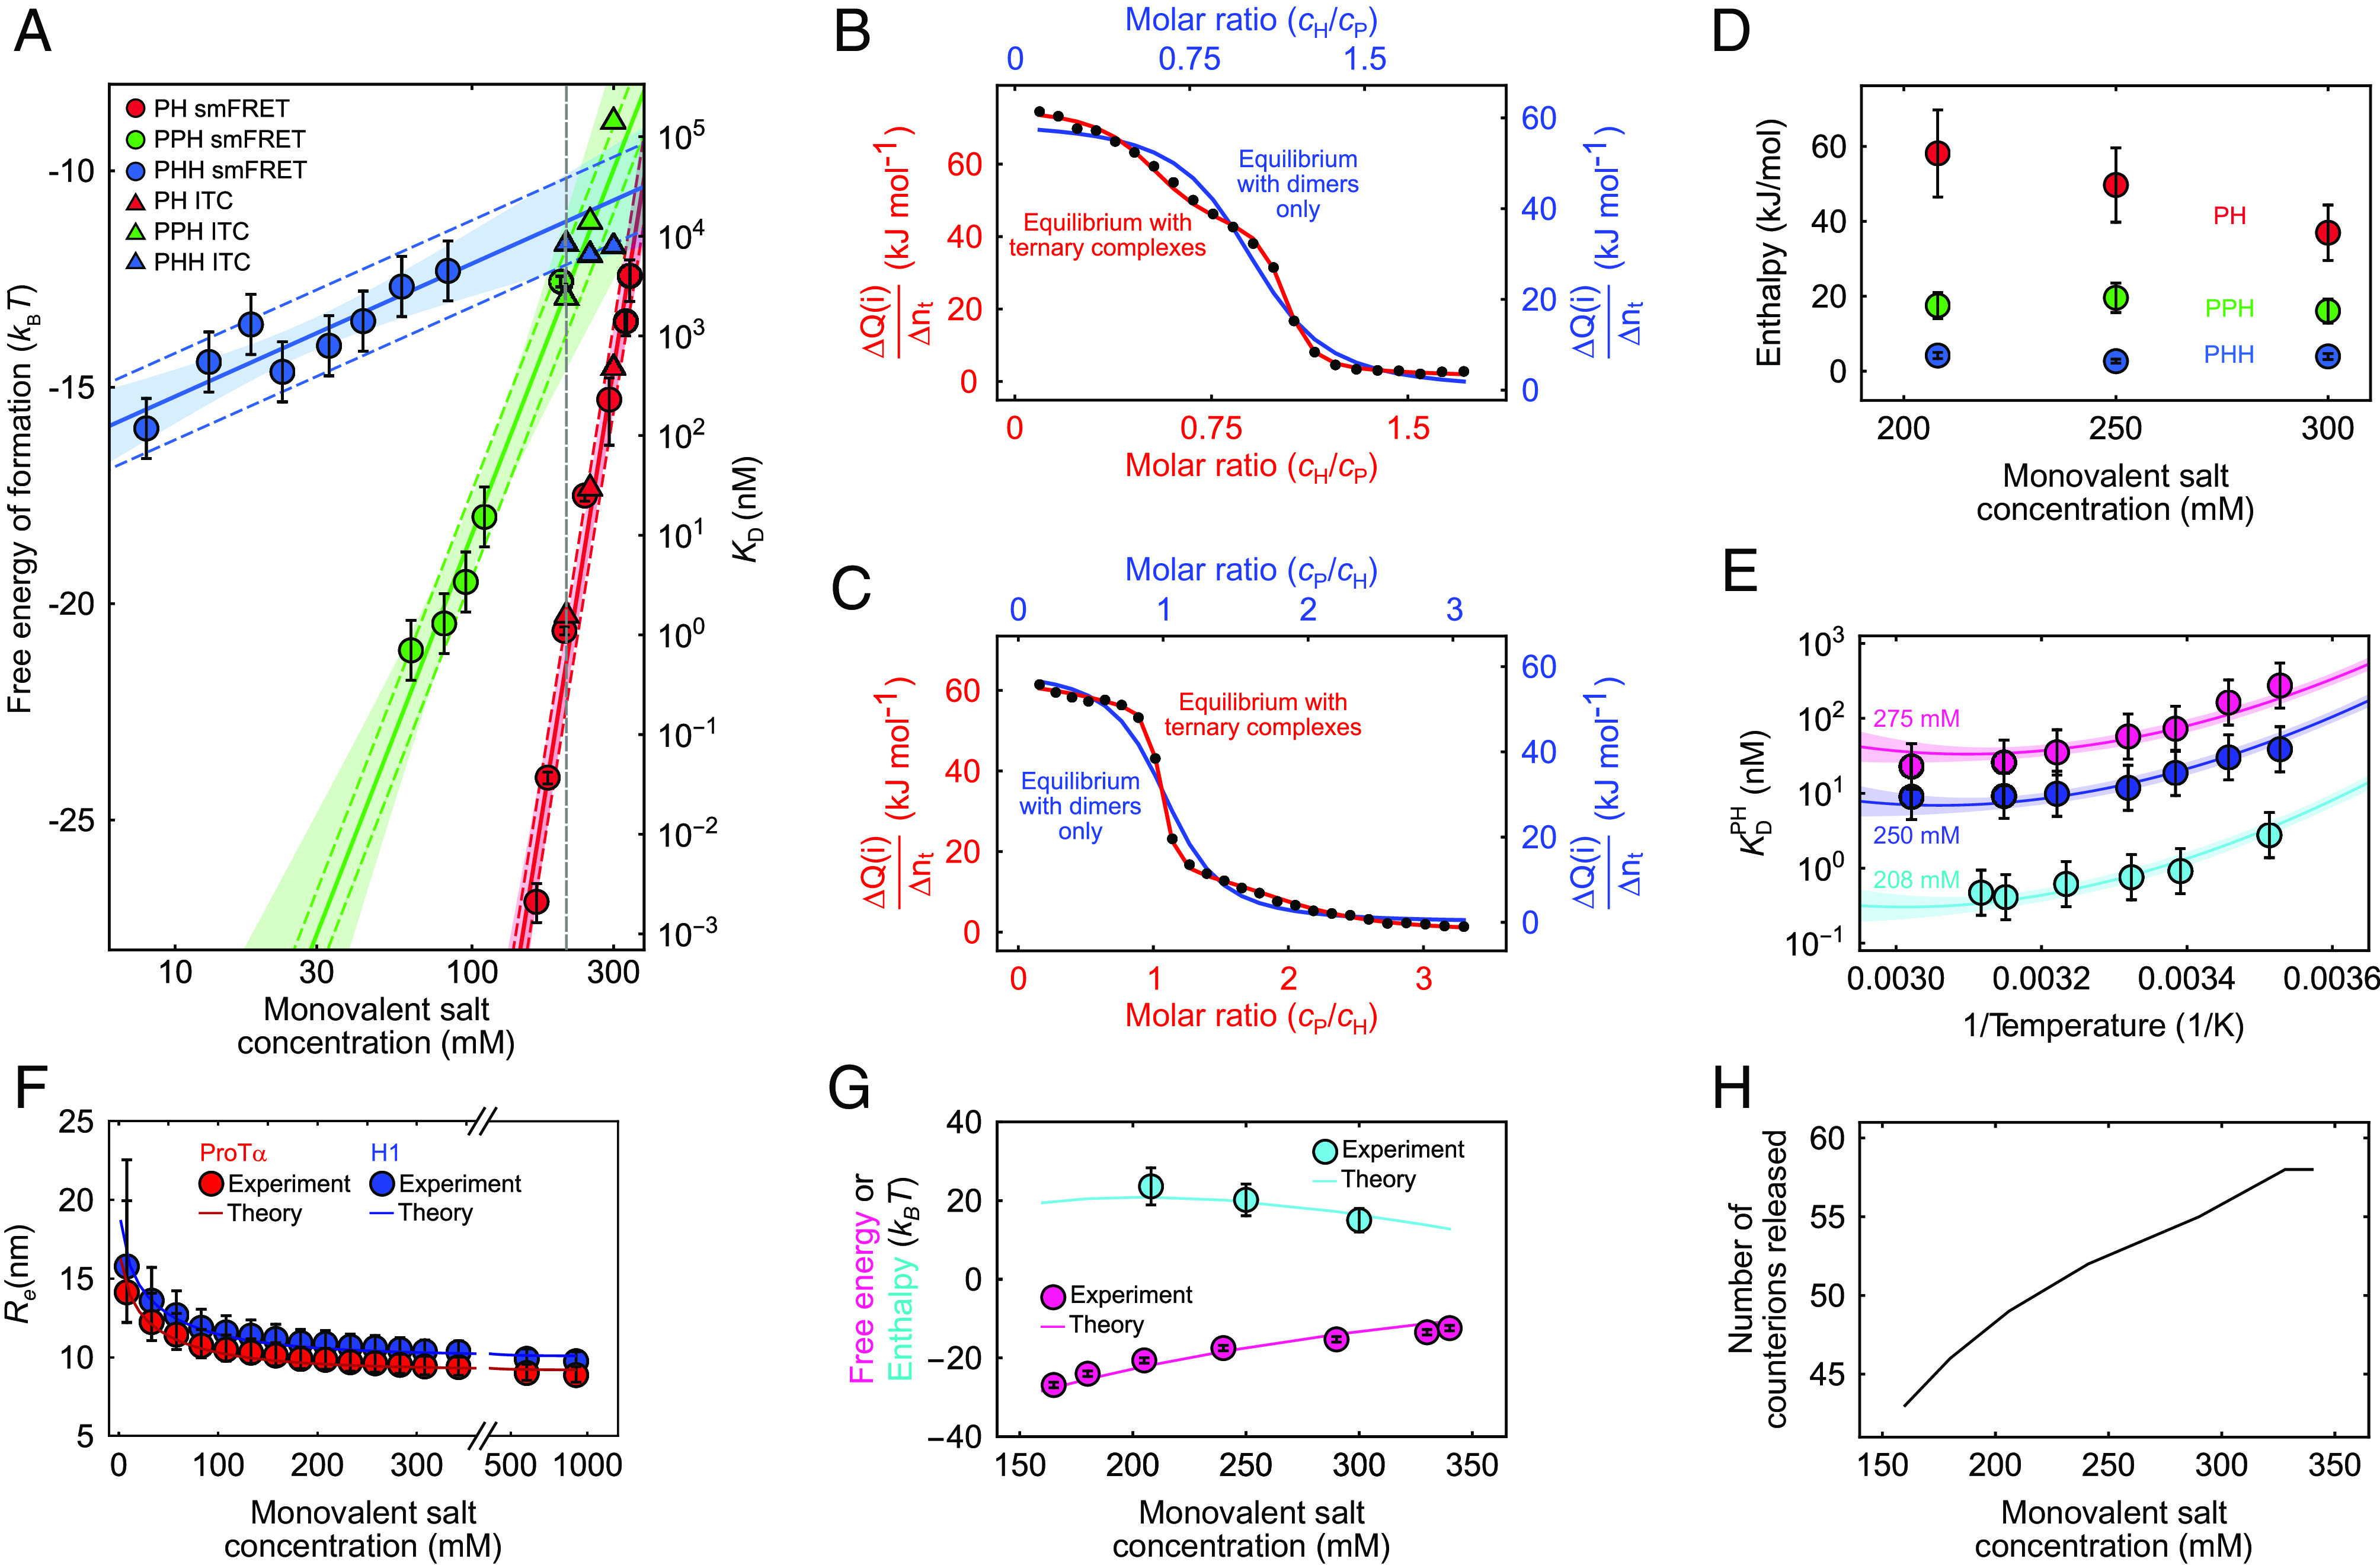
Thermodynamics of ProTα-H1 binding including ternary complex formation. (A) Free energies and dissociation constants of forming PH dimers (red) and the ternary complexes PPH (green) and PHH (blue) from single-molecule FRET (circles; including previously published data (13, 59)) and ITC (triangles; see SI Appendix, Fig. S2, for titrations) as a function of monovalent salt concentration and fits with Eq. 3 (or analogous for PPH and PHH, solid lines; shaded bands: 90% CIs). Error bars on single-molecule data for PH are from Borgia et al. (13); for PHH and PPH, error bars represent a conservative systematic error of a factor of 2 on KD (SI Appendix). Colored dashed lines represent ±1 kBT from the fit lines, the upper bound estimated for the perturbation from dye labeling (59). The vertical dashed gray line indicates a monovalent salt concentration of 208 mM. (B and C) Integrated power from ITC per molar amount of injected titrant (ΔQ/Δnt; black points for each injection i) as a function of the molar ratio of both proteins, upon titrating H1 into ProTα (B) and ProTα into H1 (C) at 208 mM monovalent salt concentration. The data in (B) and (C) are globally fitted either with a 1:1 binding model (blue line and blue axis labels) or with a model including PHH and PPH ternary complexes (red line and axis labels) (see SI Appendix for details; note that the molar ratio is a fit parameter and thus slightly different for the two analyses). (D) Enthalpies of forming PH (red), PPH (green), and PHH (blue) from the ITC analysis (B and C and SI Appendix, Fig. S2) as a function of monovalent salt concentration. Error bars of ±20% are from the constraints on the protein concentrations used in fitting (SI Appendix, Table S2). (E) Temperature dependence of ProTα-H1 dissociation constants from single-molecule FRET measurements, shown as Van ‘t Hoff plots, at 208 mM (cyan), 250 mM (blue), and 275 mM (magenta) monovalent salt concentration. Error bars represent a conservative systematic error of a factor of 2 on KD (SI Appendix). All three datasets are fitted globally with the integral form of the Van ‘t Hoff equation (solid lines; SI Appendix), with the heat capacity change upon binding as a shared fit parameter (SI Appendix; shaded bands: 90% CIs). (F) Salt dependence of the average end-to-end distance, , for ProTα (red circles) and H1 (blue circles). for ProTα was measured using single-molecule FRET; for H1, it is approximated using the scaling exponents for ProTα (see SI Appendix for details). Error bars are estimated from a conservative systematic error of ±0.03 on transfer efficiencies. The blue and red lines show for ProTα and H1, respectively, using the theory for single isolated polyelectrolyte chains (see SI Appendix for details). (G) Comparison of the experimental free energy (magenta circles) and enthalpy (cyan circles) of ProTα-H1 complex formation as a function of monovalent salt concentration with those estimated from the theory of polyelectrolyte complexation (magenta and cyan lines for enthalpy and free energy, respectively; see SI Appendix for details). Error bars on experimental free energy and enthalpy as in (A) and (D). (H) The number of counterions released upon PH formation from the theory of polyelectrolyte complexation (see SI Appendix for details).
