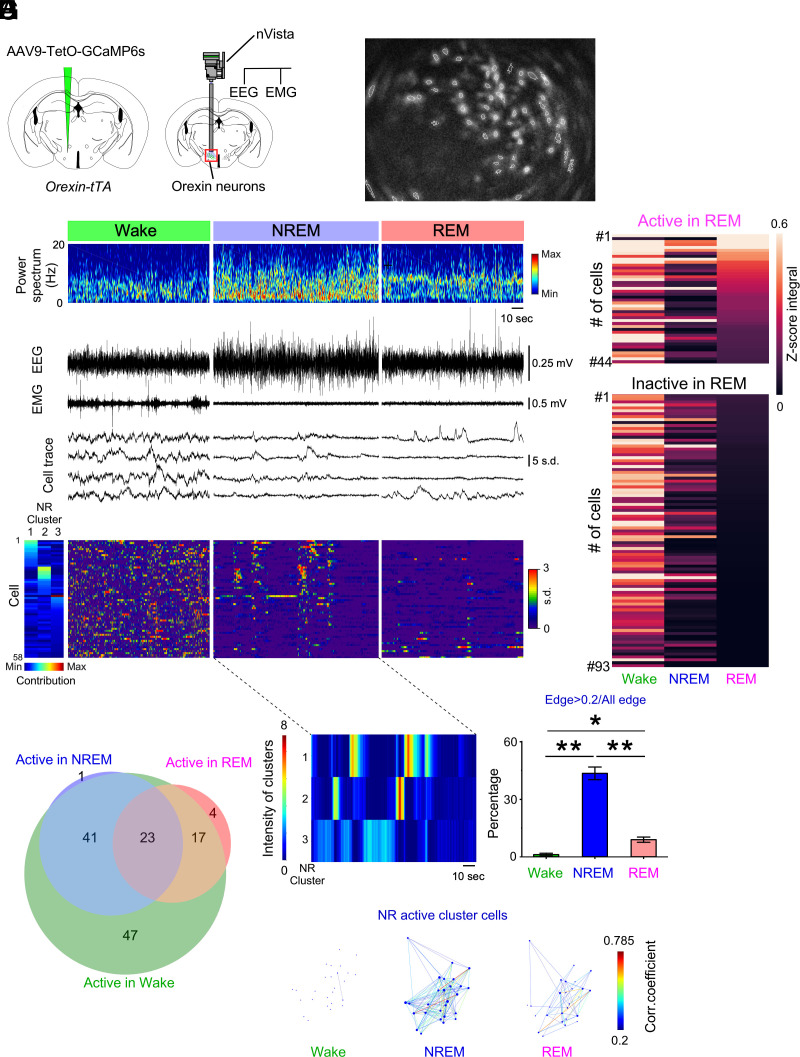
Fig. 2.
Activity recordings of orexin neurons across vigilance states in orexin-tTA mice as determined by microendoscopy. (A) Schematics of GCaMP6s expression (Left) and nVista microendoscopy with EEG and EMG recordings (Right). (B) Representative identification of orexin neurons using nVista. Dashed white line indicates region of interest (ROI). (C) Representative traces of Ca2+ activity during each vigilance state. (D) Activity of orexin neurons aligned by contribution to the three NREM clusters in G. (E) Activity during each vigilance state of orexin neurons determined to be active (n = 44 cells) or inactive (n = 93 cells) during REM sleep in N = 5 mice. (F) Venn diagram showing the number of orexin neurons (133 cells) exhibiting each activity pattern. A total of 137 cells were detected; four neurons were not classified. (G) Representation of the activity of orexin neurons within NREM clusters 1, 2, and 3. (H) Representative correlations of activity among orexin neuron pairs from NREM-active clusters 1 and 2 in G. Each dot reflects the location of the cells determined by the (x, y) position of the center of the neuron in the field of view. (I) Percentage of cells exhibiting activity synchronization, defined by the proportion of correlated (>0.2) pairs during each vigilance state. Values are the mean ± SEM. *P < 0.05, **P < 0.01. Statistical analyses are shown in SI Appendix, Table S1. W, wakefulness; NR, NREM; R, REM.

