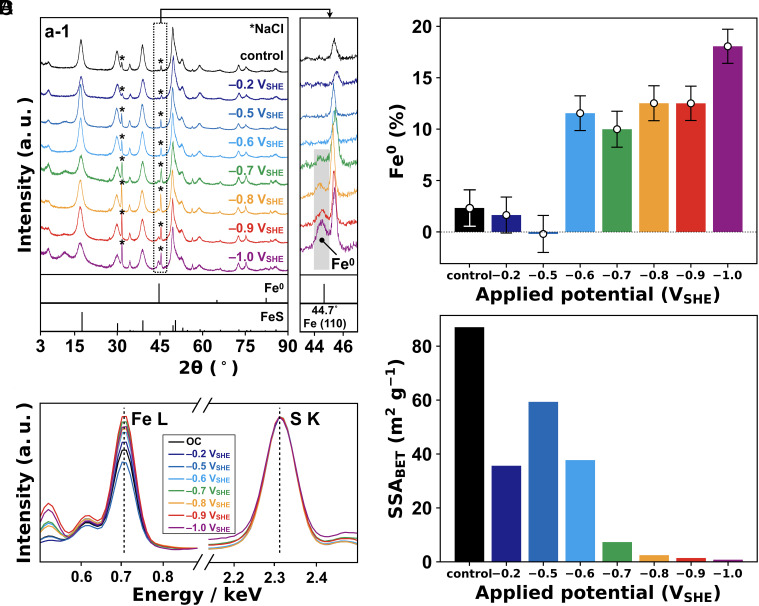
Fig. 1.
Characteristics of electrolyzed mackinawite. (A) XRD patterns of mackinawite. Asterisks show the residual NaCl, and spectra at 43–47° are magnified on the right. The condition without applying voltage is shown as control. (B) Normalized EDS spectra. EDS profiles in a wider energy range (0–4 keV) are shown in SI Appendix, Fig. S3. (C) Percentages of in electrolyzed mackinawite determined from the EDS signal intensity of Fe (0.7 keV) relative to S (2.3 keV). Error bars are the SD of EDS measurements. (D) BET-specific surface area. We did not carry out the electrochemical experiment at potentials between and because the potential monitored during the control experiment ranged between and (SI Appendix, Fig. S10).

