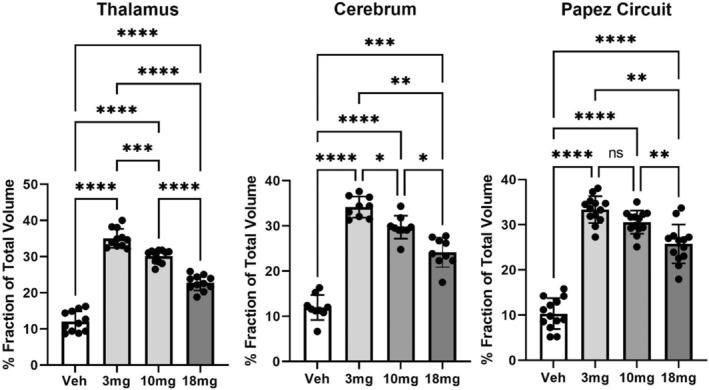
FIGURE 3.

Dose‐dependent effects of (−)‐MBP. Shown are bar graphs (mean ± SD) and dot plots (brain areas) presented as the mean of percent fraction of the total volume of activation in each brain area across all experimental conditions. The inverse response to each dose of (−)‐MBP is significantly different from vehicle and each other with the exception of the 3.0 and 10 mg doses in Papez circuit. *<.05; **<.01; ***<.001; ****<.0001.
