
FIGURE 4.
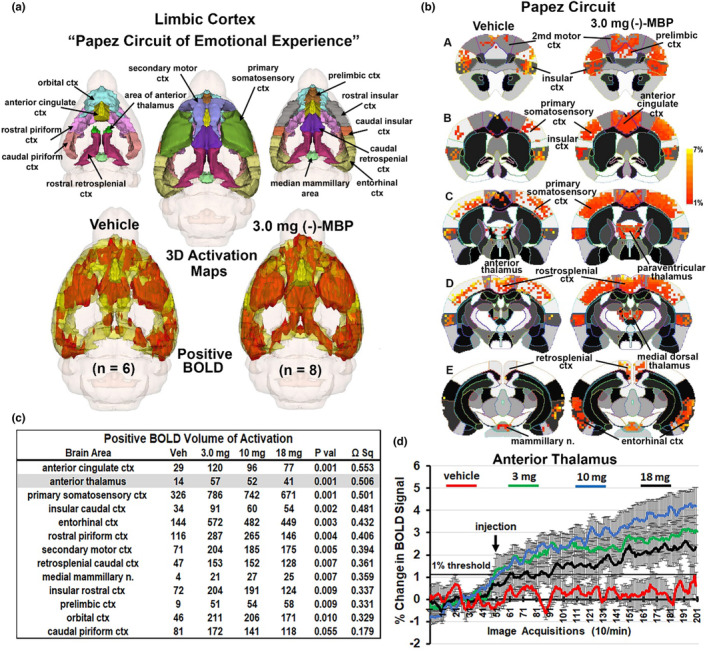
Circuit of Papez. (a) Shows the color‐coded 3D volumes that comprise Papez circuit. These volumes are coalesced into a single yellow volume below showing the average positive BOLD signal (red) from all subjects. (b) To the right is 2D activation maps from the rat brain atlas showing the precise location of the significantly positive (red) BOLD voxels. Each voxel is the average signal from all subjects for vehicle or 3.0 mg dose of (−)‐MBP. The table in (c) is the brain areas that comprise Papez circuit ranked in order of significance. The time course plot in (d) to the right shows the percent change in BOD signal for the anterior thalamus for each experimental condition over the 20 min scanning session. Arrow denotes time of I.P. injection. Vertical lines denote SE.