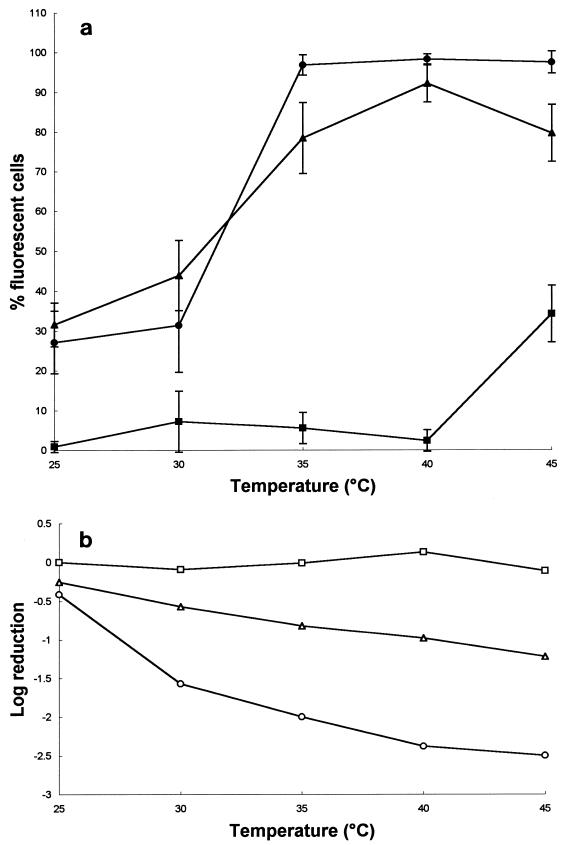
FIG. 10.
Effect of increasing temperature (25 to 45°C) on the membrane permeability (solid symbols) (a) and viability (open symbols) (b) of mid-exponential-phase cells of S. cerevisiae X2180-1A (YEPD, pH 6.0) exposed to 0 (■, □), 3.45 (▴, ▵) and 8.63 (○, •) μg of DS s3 (1-16) per ml for 10 min. Membrane permeability was measured by fluorescence microscopy as described in the text, and each datum point represents the mean and standard deviation acquired from the counting of at least 300 randomly captured cells.

