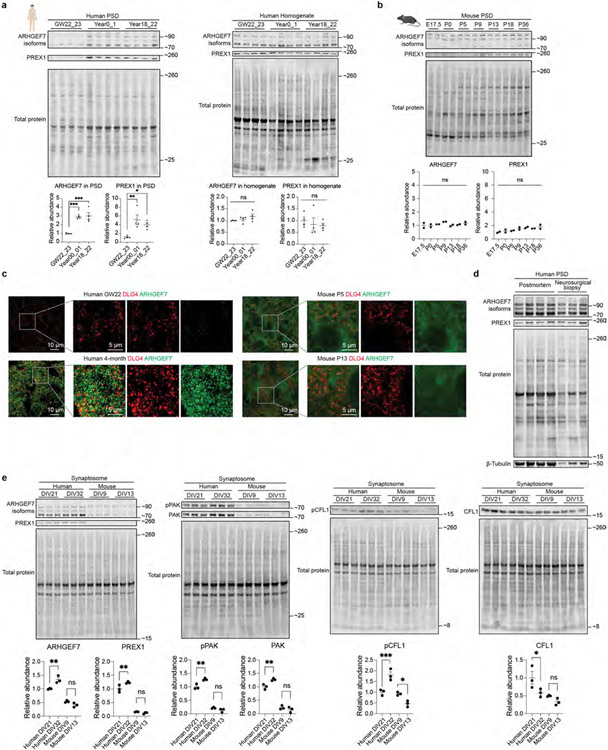
Extended Data Fig. 8 ∣. RhoGEF levels and activities during synapse development.
a, Immunoblots and quantification of ARHGEF7 and PREX1 in the PSD and homogenate of developing human cortex (n = 4, 4 and 4 samples). Data are presented as mean values ± s.e.m. The P values were obtained from one-way ANOVA with Holm-Sidak’s multiple comparisons test; *P < 0.05, **P < 0.01, ***P < 0.001. b, Immunoblots and quantification of ARHGEF7 and PREX1 in the PSD of developing mouse cortex (n = 2, 2, 2, 2, 2, 2 and 2 samples). Data are presented as mean values ± s.e.m. The P values were obtained from one-way ANOVA; ns, not significant. c, Original large field of view images for producing processed images in Fig. 4b (scale bar: 10 μm or 5 μm as indicated in the figure). d, Comparison of adult human PSD samples from postmortem brain tissues and neurosurgical biopsy tissues by western blot analysis (n = 4 and 3 samples). e, Immunoblots and quantification of ARHGEF7, PREX1, phospho-PAK, PAK, phospho-CFL1, and CFL1 in the synaptosomes of cultured primary human (n = 3 and 3 samples) and mouse cortical neurons (n = 3 and 3 samples) at indicated days in vitro (DIV). Data are presented as mean values ± s.e.m. The P values were obtained from one-way ANOVA with Holm-Sidak’s multiple comparisons test; *P < 0.05, **P < 0.01, ***P < 0.001, ns, not significant. The human and mouse illustrations were created with BioRender.com.

