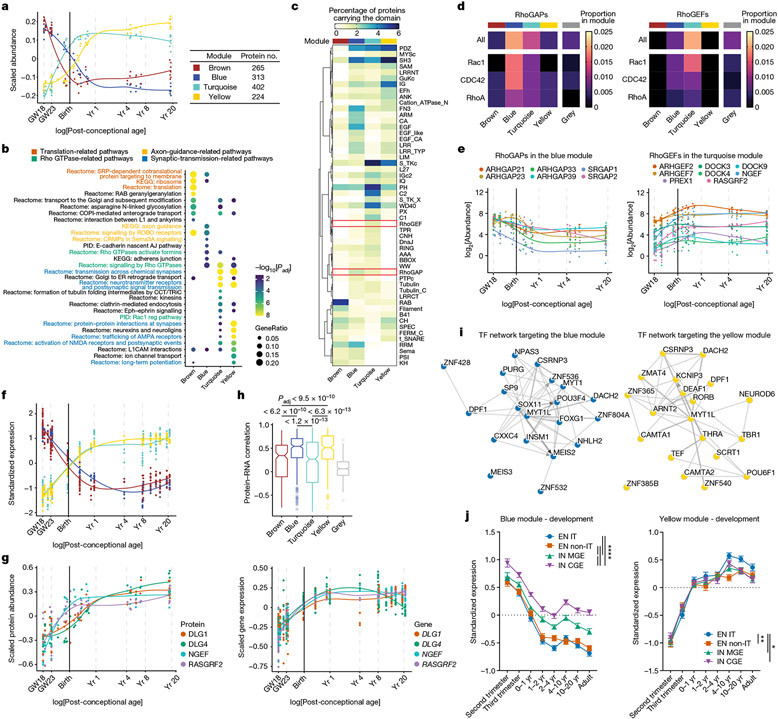
Fig. 2 ∣. Protein modules of the developing human PSD.
a, Scaled abundance patterns (module eigengene values) of four protein modules of the human PSD identified by WGCNA. b, Pathway enrichment analysis of each module. GeneRatio, proportion of genes in the pathway that are present in the module; AJ, adhesion junction. Nominal P values from hypergeometric test were adjusted by the Benjamini–Hochberg method. c, Distribution of protein domains in each module. d, Proportions of RhoGAPs (left) and RhoGEFs (right) and their subtypes in each module. e, Abundance patterns of RhoGAPs in the blue module (left) and RhoGEFs in the turquoise module (right). f, Standardized median expression values of genes encoding proteins of the four PSD modules in the BrainSpan data. g, Scaled protein abundance (left) and gene expression (right) patterns of DLG1, DLG4, NGEF and RASGRF2. h, Spearman correlation coefficients between protein abundance and gene expression of PSD proteins in each module (left to right: n = 236, 283, 371, 212 and 504 proteins). Box plot centre, median; hinges, the 25th and 75th percentiles; whiskers, 1.5 × interquartile range. The P values were obtained from Kruskal–Wallis test with Dunn’s multiple comparisons test. i, Transcription factor (TF) networks that regulate genes in the blue (left) and yellow (right) modules. j, Standardized expression values of genes in the blue (n = 298 genes; left) and yellow (n = 217 genes; right) modules in individual neuronal subtypes of developing human neocortex. EN IT, excitatory intratelencephalic neuron; EN non-IT, excitatory non-intratelencephalic neuron; IN MGE, inhibitory neuron derived from the medial ganglionic eminence; IN CGE, inhibitory neuron derived from the caudal ganglionic eminence. Data are presented as mean values s.e.m. Nominal P values from two-way analysis of variance (ANOVA) were adjusted by the Benjamini–Hochberg method; *P < 0.05, **P < 0.01, ****P < 0.0001.

