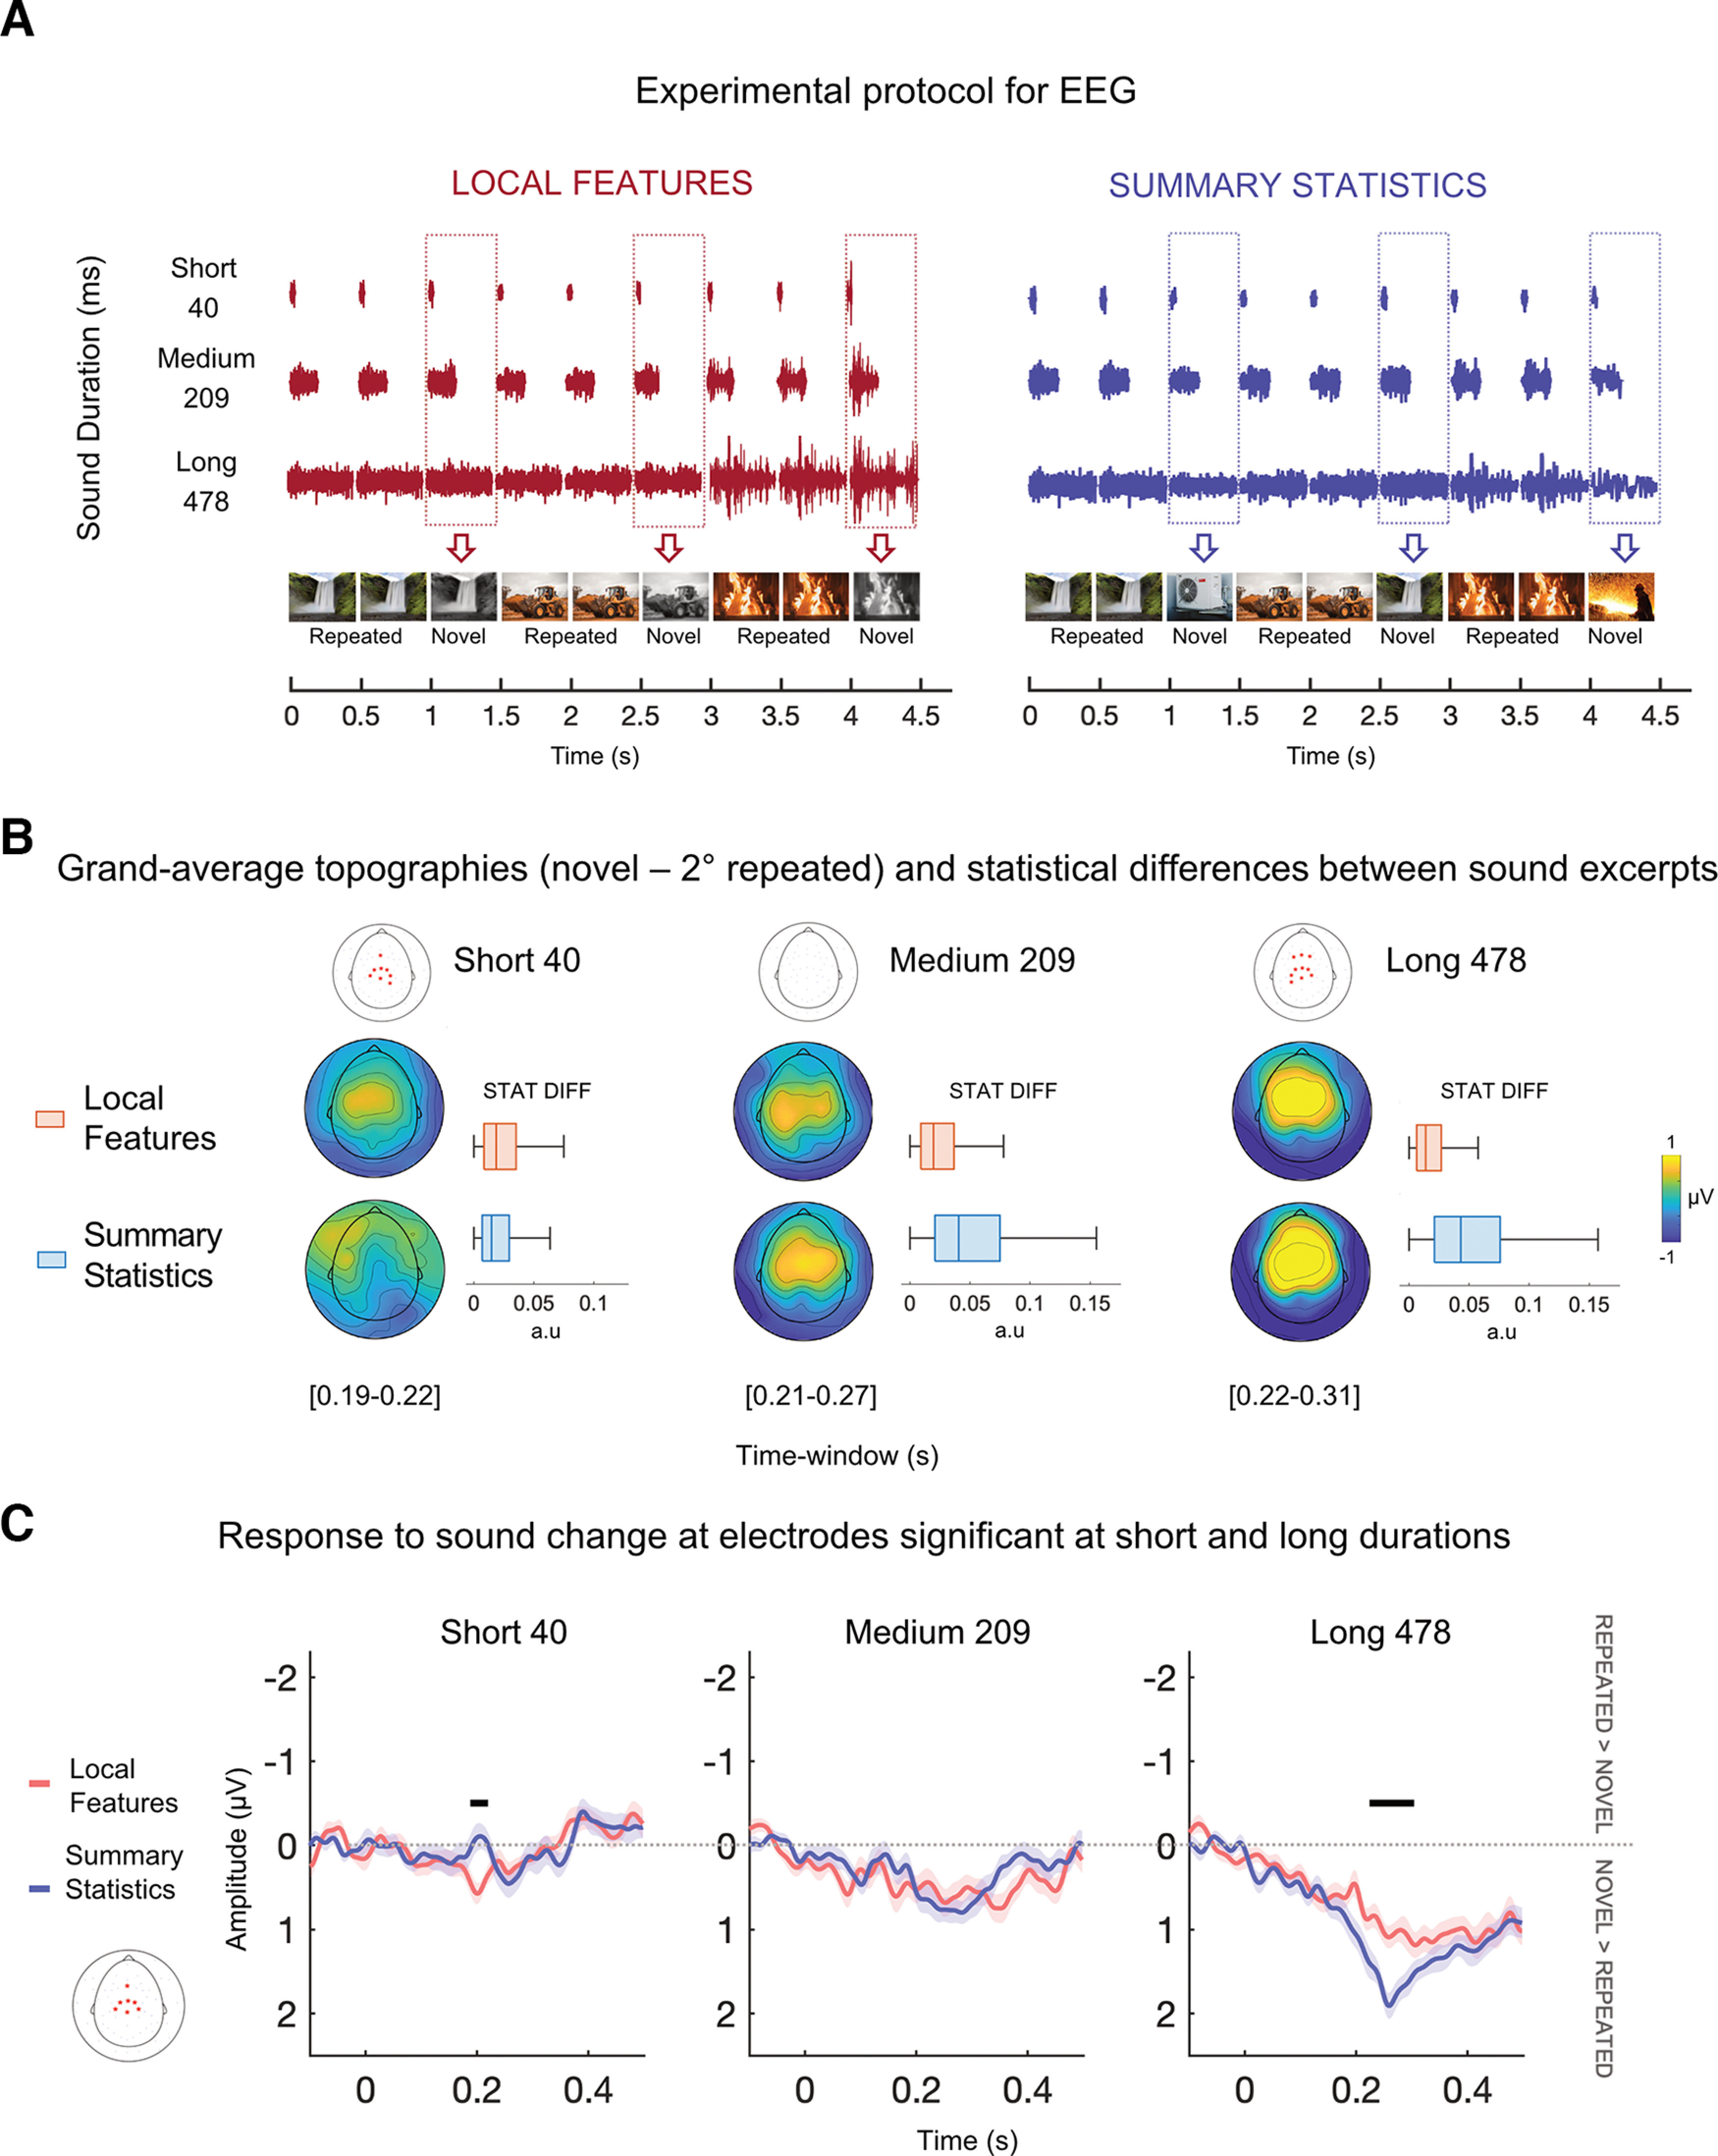
Figure 2.

Experimental procedure and results of time domain analysis. A, Experimental protocol for EEG. Triplets of sounds were presented at a fast rate (one sound every 500 ms). Two sounds were identical (repeated), while the third was different (novel) and could vary in its local features (left) or summary statistics (right) depending on the experiment (local features or summary statistics). Three sound durations, equally spaced logarithmically (short, medium, and long: 40, 209, and 478 ms), were employed (in different sound streams) to tap into each auditory mode separately (local features vs summary statistics processing). The list of presented sound textures is available as Extended Data Figure 1-2. To ensure participants were attentive during the presentation, they performed an orthogonal task, consisting of pressing a button when an infrequent target (beep) appears. Performance accuracy was high in all experiments and durations and is displayed in Extended Data Figure 1-1. B, Grand average topographies of the differential response associated with the sound change (novel sound minus repeated sound) at significant latencies for each experiment and duration. For each latency, electrodes associated with significant clusters are displayed above as red stars on the scalp. *p < 0.025. On the right side of the topographical maps, the boxplots represent objective differences between the novel and repeated sounds of all auditory statistics (averaged). The difference was computed between the statistics of sounds presented for each run, experiment, and duration and averaged across all participants. Within each duration, medians differed at the 5% significance level between experiments. Local features > summary statistics at short (40) duration and summary statistics > local features for medium (209) and long (478) durations. The evoked response in the EEG agrees with the objective statistical difference measured from the sound excerpts. C, Grand average electrical activity (negative values are plotted up) of the differential response (novel minus repeated) at significant electrodes (in red) for both short and long durations. Shaded regions show interpolated standard error of the mean (SE) at each time point. Positive values indicate that the novel sound elicited a greater response than the repeated one. Results of cluster permutation are displayed as black bars extending through significant latencies. –p < 0.025. For visualizing the ERPs before subtraction (novel-repeated), see Extended Data Figure 2-1.
