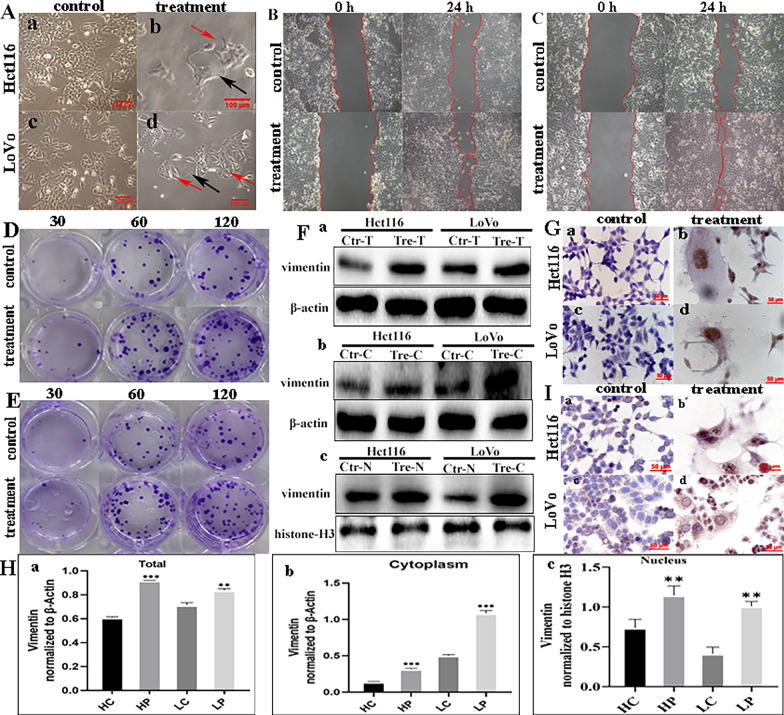
Fig. 1.
Morphologic characteristics and functional analysis of PGCCs. A PGCC induction and daughter cell generation following treatment (×100). a Hct116 control cells; b Hct116 PGCC (black arrow) and daughter cells (red arrow) after recovery from treatment; c LoVo control cells; d LoVo PGCC (black arrow) and daughter cells (red arrow) after recovery from treatment. B Wound healing assay in Hct116 cells before and after treatment at 0 and 24 h (×100). C Wound healing assay in LoVo cells before and after treatment at 0 and 24 h (×100). D Colony formation assays of 30, 60, and 120 Hct116 cells before and after treatment. E Colony formation assays of 30, 60, and 120 LoVo cells before and after treatment. F Western blot analysis of vimentin. a Total protein levels of vimentin, b cytoplasmic levels of vimentin, and c nuclear levels of vimentin. G ICC staining was performed to evaluate vimentin expression in Hct116 and LoVo cells before and after treatment (×200). H ICC staining to evaluate PIAS1 expression in Hct116 and LoVo cells before and after treatment (×200). I Grey value analysis of western blots. All data represent the means ± standard errors of the means of at least three independent experiments. a Total protein levels of vimentin, b cytoplasmic levels of vimentin, and c nuclear levels of vimentin. P values were calculated using a one-way analysis of variance. *P < 0.05; **P < 0.01; ***P < 0.001. PGCCs polyploid giant cancer cells, PDCs PGCCs with daughter cells, HC Hct116 control cells, HP Hct116 PDCs after treatment, LC LoVo control cells, LP LoVo PDCs after treatment, ICC immunocytochemical

