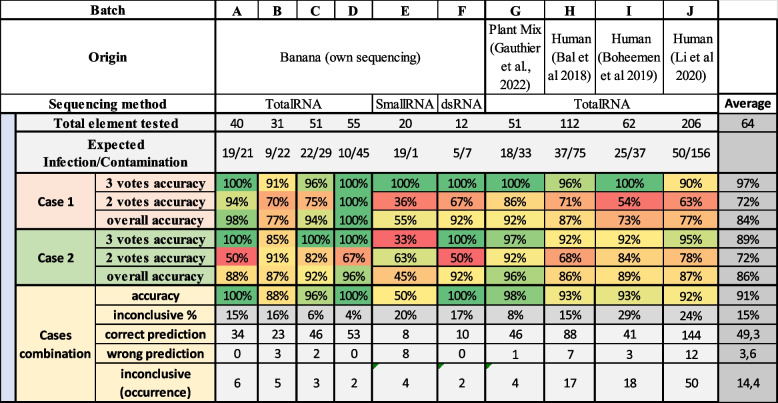
Table 6.
Percentage of the accuracy of case 1 and case 2 analysed alone or in combination from sequencing with relaxed mapping parameters (except for small RNA) for each element (virus detected on each sample). Each case is presented with the proportion of correct or wrong predictions according to the number of votes obtained (2 or 3) by comparing Cont-ID prediction the the viral status (displayed in expected infection/contamination). The percentage given by three votes confidence count only the result with three votes while the overall accuracy aggregates the 2 and 3 vote results. When combining results from both cases (described in Fig. 3), the percentage of inconclusive results and the number of correct or wrong predictions are stated. Several virus datasets were tested, banana samples (only non-BSV viruses are considered), a mix of plants, and human datasets

