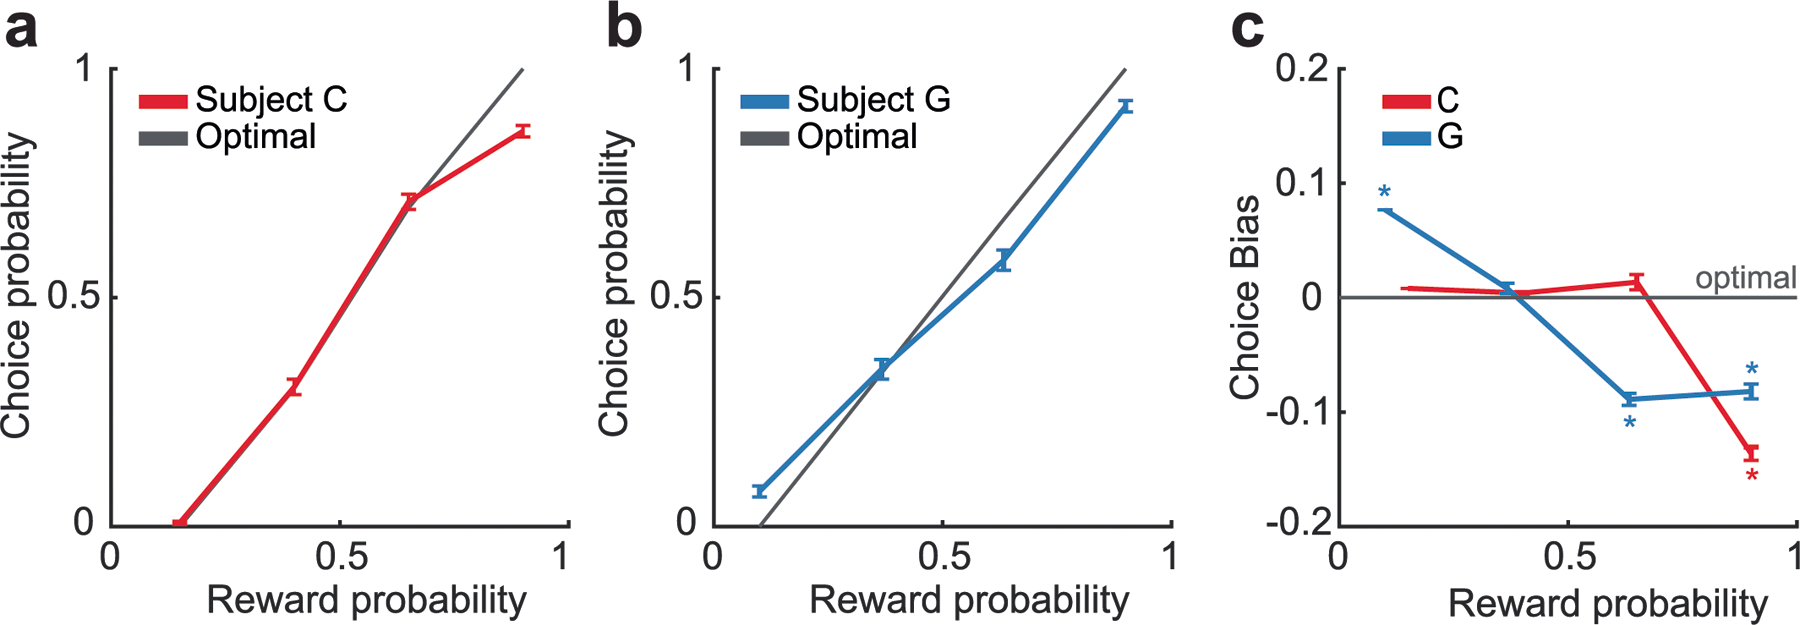
Extended Data Fig. 1 |. Choice biases as a function of reward probability.

(a) Probability of subject C selecting a given choice option as a function of the probability of reward predicted by the option, as compared to the optimal choice as given by equation 1. N = 12508 trials. Error bars denote the standard error of the mean. (b) Same data as for subject G. N = 4902 trials. Error bars denote the standard error of the mean. (c) Difference of subjects’ choices from choice optimality as a function of the probability of reward. Asterisks indicate significant differences from zero (p < 0.001, one-sample t-test corrected for multiple comparisons). Error bars denote the standard error of the mean.
