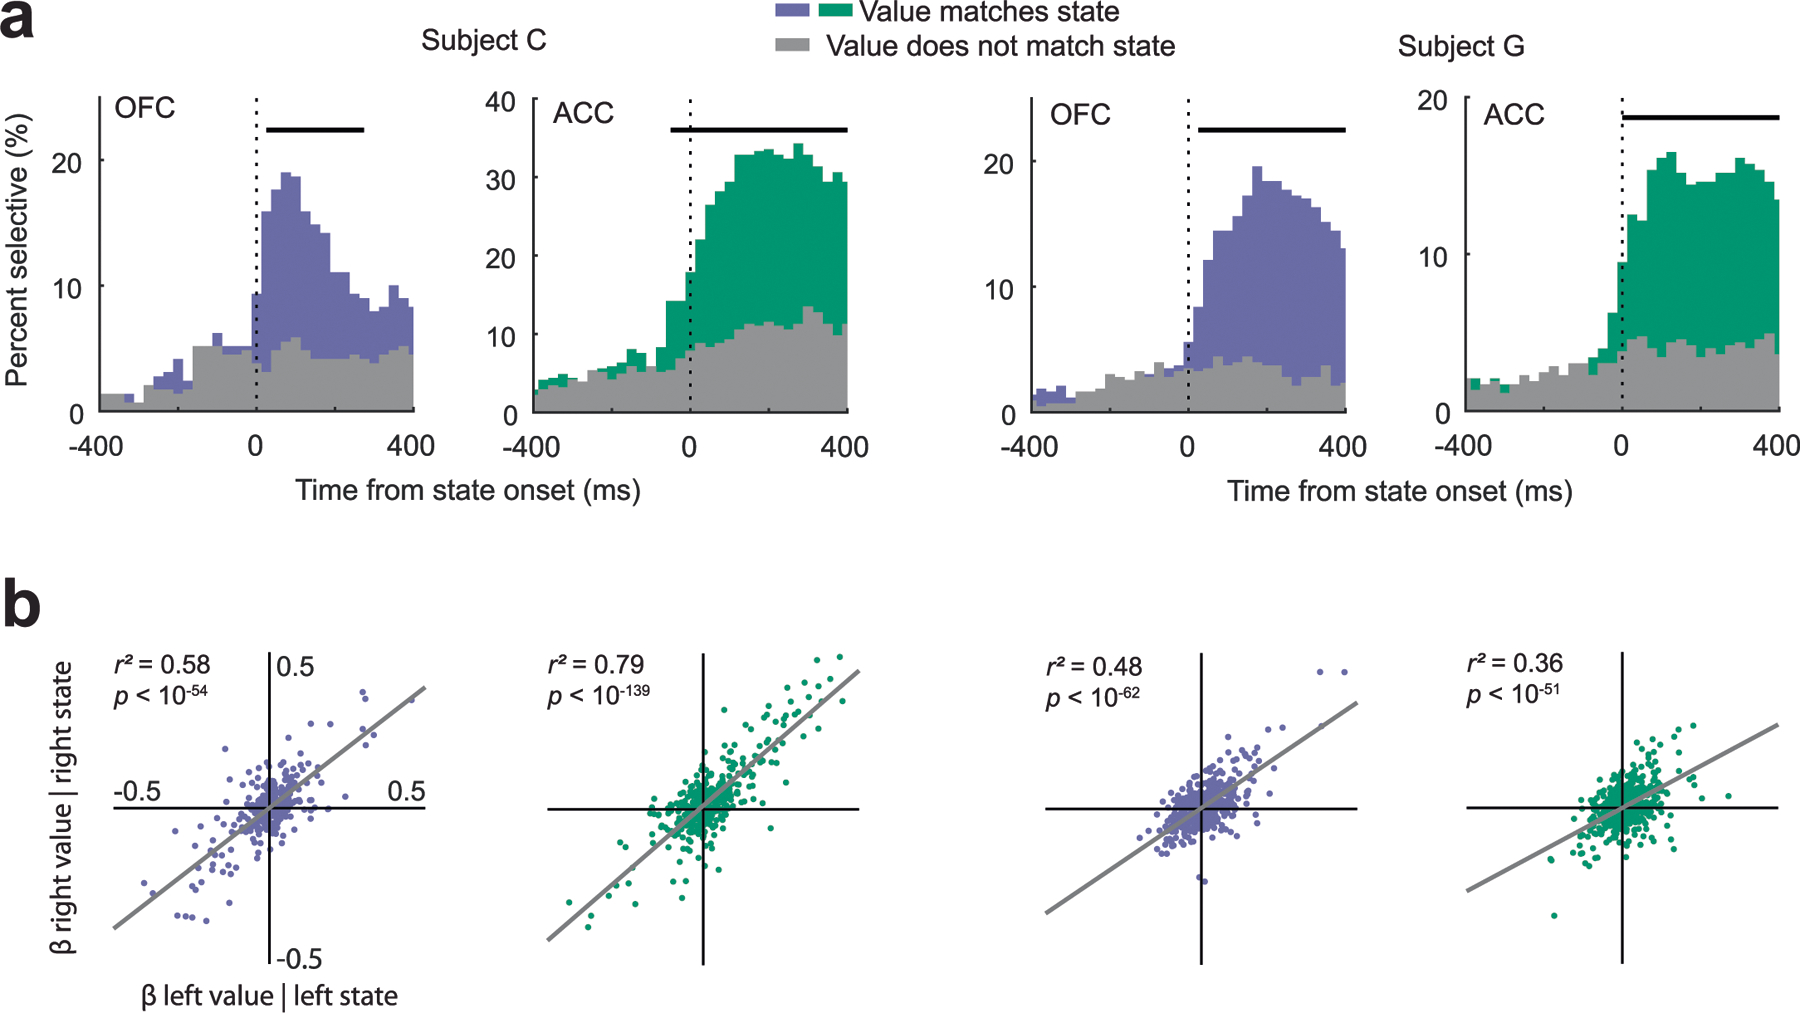
Extended Data Fig. 4 |. Relationship between single neural activity and population-level decoding.

(a) More neurons significantly encoded the value of the same option that was currently reported by the decoder (color) than significantly encoded the value of the alternate option (gray). Significant encoding was determined by regressing the neuron’s firing rate (synced to the onset of the decoder state) against either the value of the option reported by the decoder or the value of the alternate option (assessed at p < 0.01). Horizontal gray bars indicate significant differences between the proportion of neurons encoding the current versus alternate option ( test, p < 0.01). (b) Each data point is the beta coefficient from each neuron’s standardized firing rate during the first 100 ms immediately after state onset regressed against the parameters shown on the x- and y- axes. In both regions and both subjects there was a strong correlation between a neuron’s encoding of value for the left or right option when either was currently being reported by the decoder.
