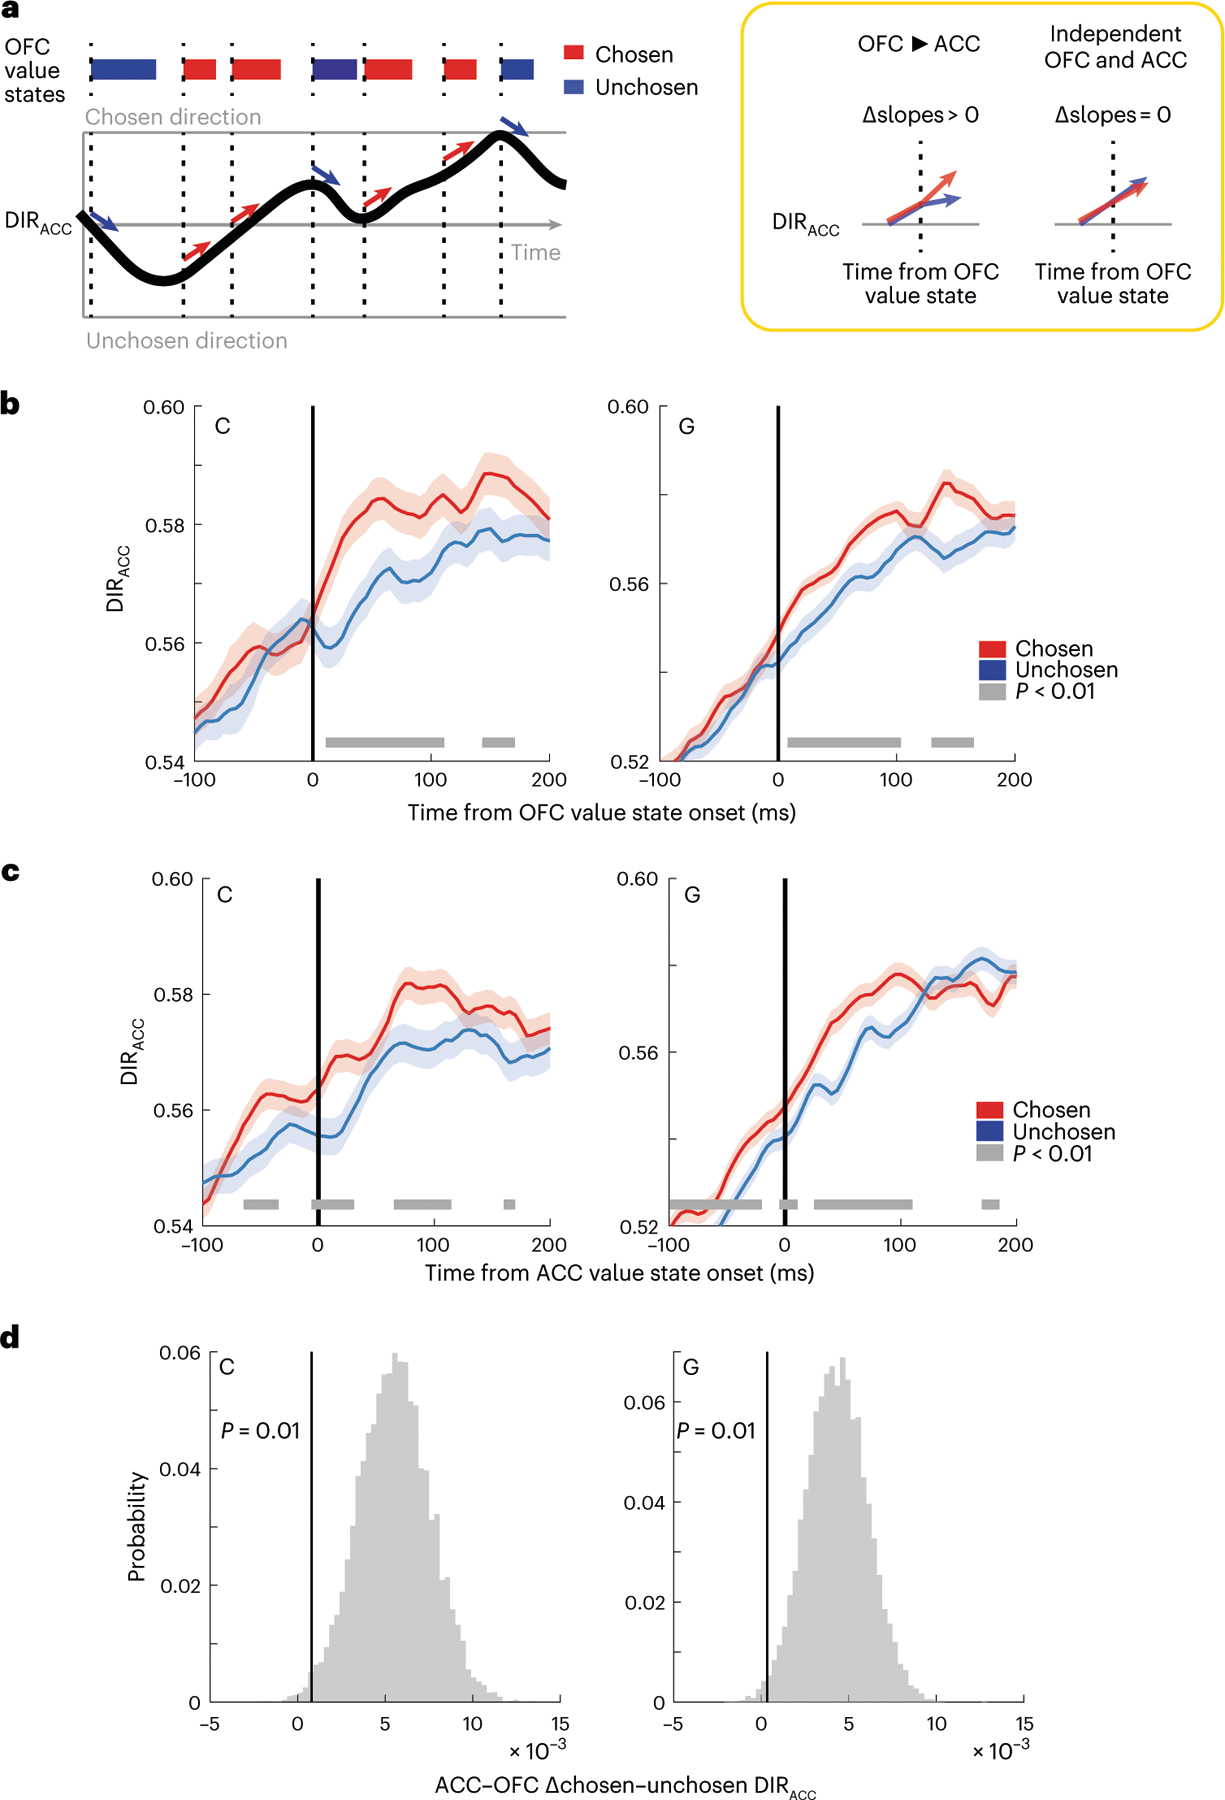
Fig. 5 |. OFC value integration.

a, Model of how OFC value state integration might affect the ramping ACC choice direction signal (left). We predict that DIRACC will increase faster following chosen (high value) states than unchosen (low value) OFC value states. The null hypothesis is that OFC value and DIRACC are independent signals. b, DIRACC aligned to the onset of chosen or unchosen OFC value states. The thick gray line indicates significant differences between the states (P < 0.01, two-sided two-sample t-tests). Error bars denote the 99% confidence intervals of the bootstrapped distributions. c, Same as b, except aligned to the onset of ACC value states. Error bars denote the 99% confidence intervals of the bootstrapped distributions. d, Difference in the effect of chosen versus unchosen value states on DIRACC aligned to ACC value states as compared to OFC states during 100 ms before the onset of the state. Positive values indicate a bigger difference in ACC, showing that the difference in DIRACC typically occurs before the onset of ACC value states, but not before OFC value states. The vertical lines indicate the first percentile of the bootstrapped distribution.
