
FIGURE 2.
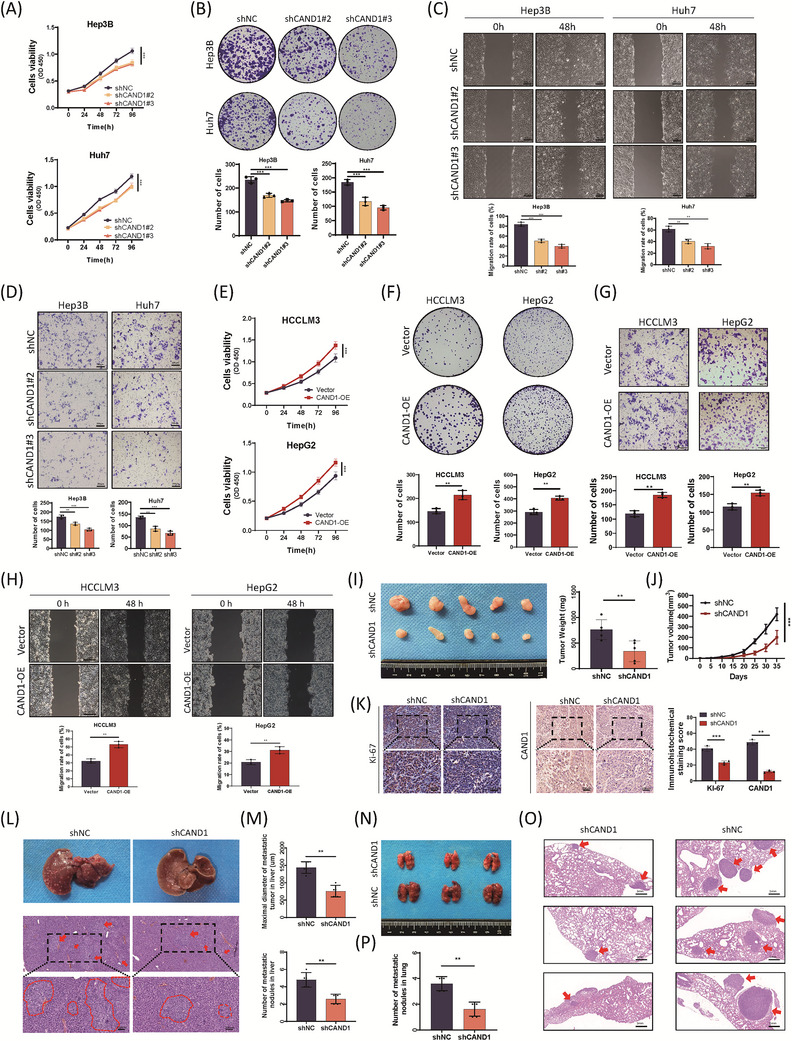
Cullin‐associated and neddylation‐dissociated 1 (CAND1) functions as an oncogene in hepatocellular carcinoma (HCC) in vitro and in vivo. (A) Cell viability was measured by Cell Counting Kit‐8 (CCK‐8) assay. (B) CAND1 knockdown impairs colony formation. (C) Wound healing assays show reduced cell migration in CAND1 knockdown cells. (D) Transwell experiments confirmed that CAND1 knockdown suppresses cell invasion. (E) CAND1 overexpression significantly promotes cell growth, as detected by CCK‐8. (F) CAND1 overexpression increases colony formation. (G, H) Transwell and wound healing assays showed that CAND1 overexpression promotes cell invasion and migration. (I) Image of subcutaneous xenograft tumours and the statistical analysis of tumour weights. (J) Growth curve of xenografts in the shCAND1 and control groups. (K) Immunohistochemical analysis of xenografts shows a decrease in Ki‐67 in the CAND1 knockdown group. (L) Typical gross appearance and hematoxylin and eosin (H&E) staining of liver metastatic tissue. (M) Maximal tumour diameters and number of liver metastasis nodules under light microscopy. (N) Representative images of pulmonary metastatic models. (O) H&E staining of metastatic nodules in the lungs. (P) The number of lung metastatic nodules was monitored under a dissecting microscope. All cellular experiments were run in triplicate and repeated three times. p < .05(*), p < .01(**) or p < .001(***).