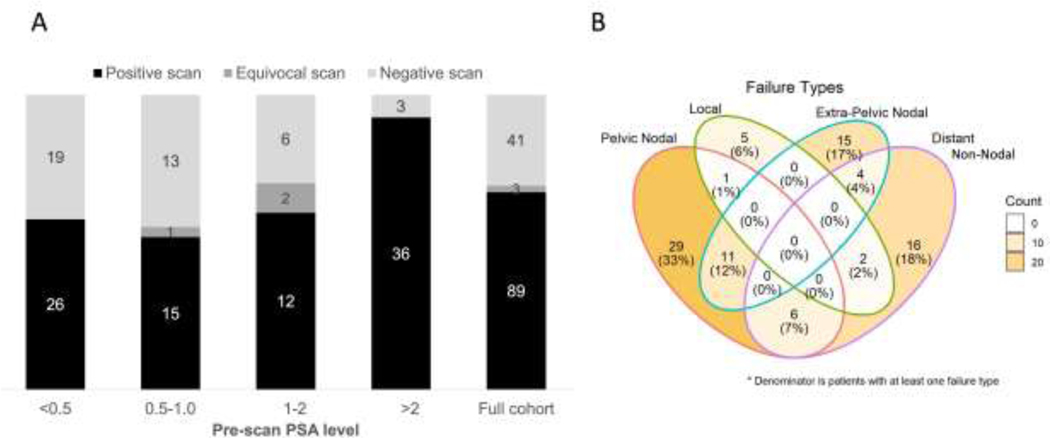
Figure 1:
A) Stacked bar chart showing the detection rates across different pre-scan PSA strata. The numbers in the bars reflect the total number of scans which were classified as positive, equivocal or negative. The distributions were significantly different by Fisher’s exact test, p=0.0003 B) Venn diagram showing granular anatomic breakdown of the PSMA PET pattern of failure at the individual patient level for scans that contain at least one positive scan finding (n=89)

