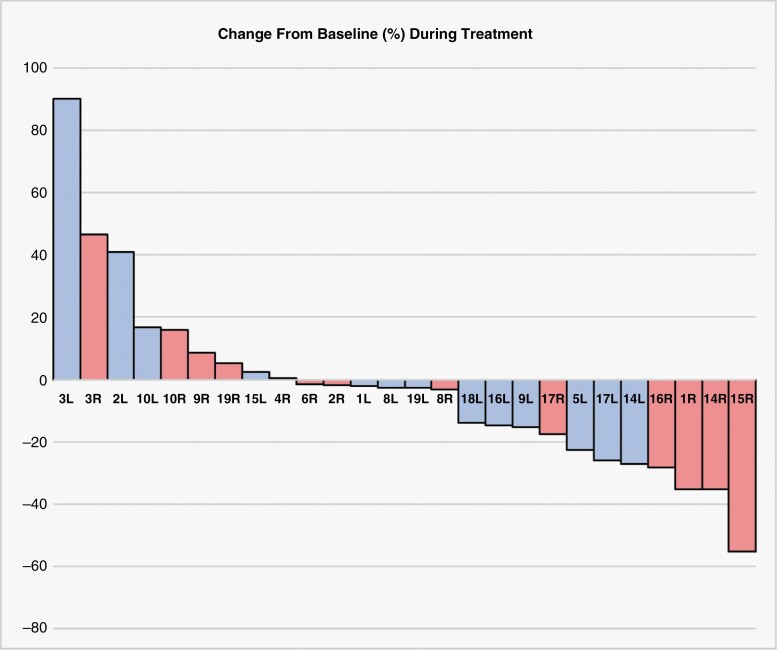
Figure 1.
Percent change in VS volume during bevacizumab therapy. Volumetric data was assessed from evaluable brain MRI at the timepoint closest to bevacizumab initiation and compared to brain MRI imaging which showed the best response or longest clinical stability. Percent volume change is normalized to the brain MRI at the timepoint closest to bevacizumab initiation. Patient ID number and laterality of the specific VS are shown.

