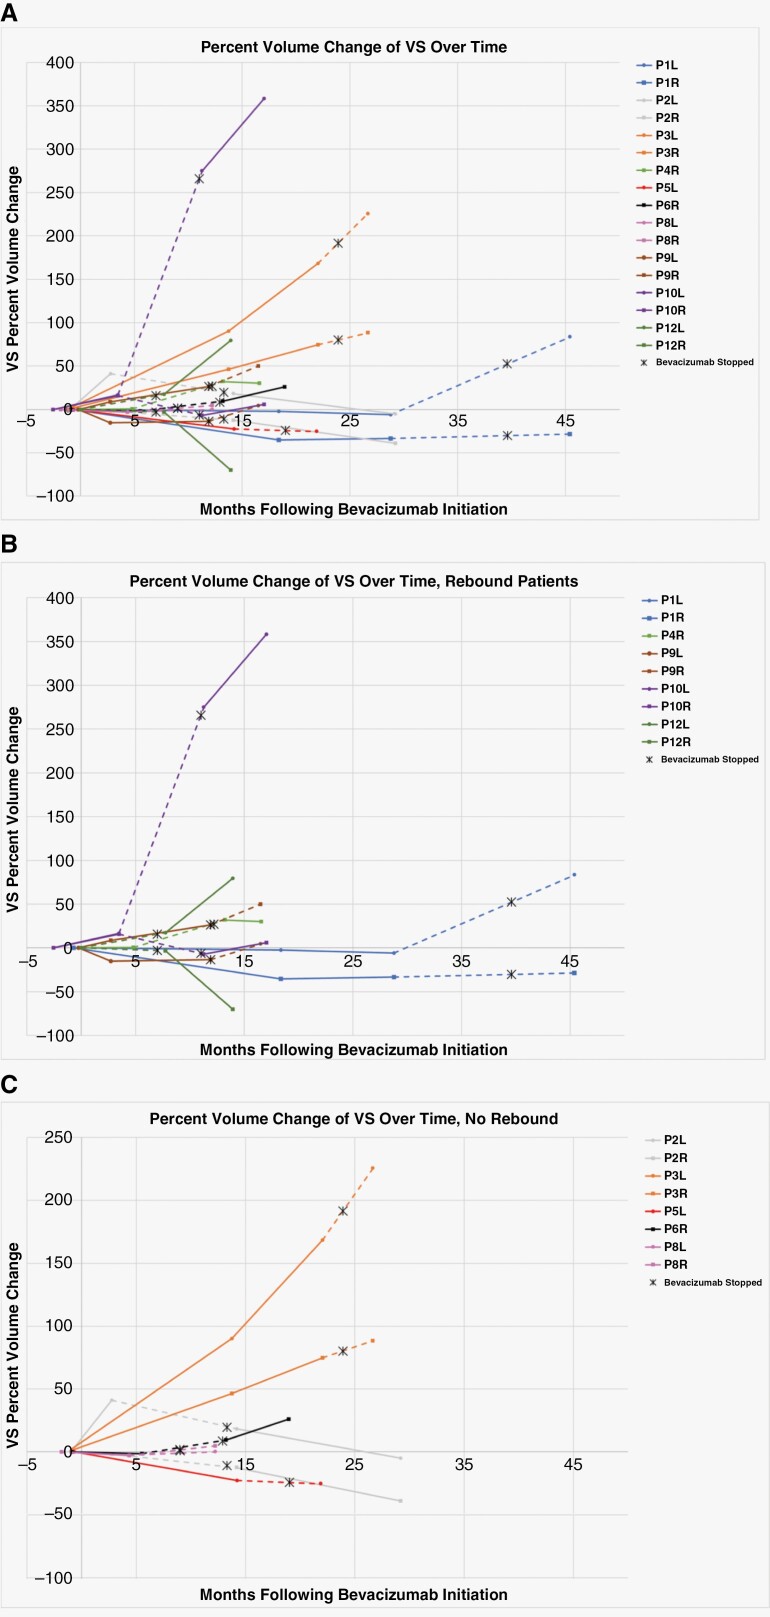
Figure 2.
Percent change in VS volume during and after bevacizumab therapy. Volumetric data was assessed from evaluable brain MRI at the timepoint closest to bevacizumab initiation and compared to brain MRI imaging which showed the best response or longest clinical stability, the closest timepoint to bevacizumab discontinuation, and the following timepoint >1 month after bevacizumab discontinuation. The dotted line represents the time interval during which bevacizumab therapy was terminated. (A) All evaluable patient VS volume changes over time. (B) Patients with >20% growth in at least one VS following bevacizumab termination. (C) Non-responsive to bevacizumab patients (ID 2 and 3) and patients with VS volume stability after bevacizumab termination. *Patient ID 12 had a prolonged period of bevacizumab therapy (88 months). For clarity, the first brain MRI time point has been altered to 0 months, with additional MRI time points reflecting that change.

