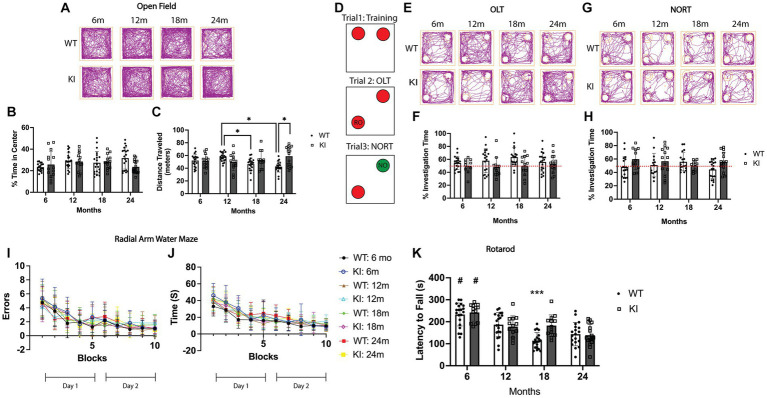
Figure 1.
Behavioral assessment of MAPT KI and WT mice. Male and female human MAPT knock-in (MAPT KI or KI) and wild type (WT) mice completed a battery of behavioral tests at 6, 12, 18, and 24 months (m) of age (n = 6–10/group). For all tasks, no sex differences were detected within a given age and genotype (see Supplementary Table S1 for data on individual sexes). Sexes were combined within age and genotype for all subsequent analyses. (A) Representative track traces from the open field test. (B) Quantification of the percent of time spent within the center square of the open field apparatus. (C) Quantification of total distance traveled (in meters) in the open field apparatus. 24 m WT mice traveled significantly less distance during the open field test than 24 m MAPT KI mice, and the 12 m WT mice. 18 m WT mice traveled significantly less distance than 12 m WT mice. (D) Schematic illustration of the object location task (OLT) and novel object recognition task (NORT). Briefly, mice were trained to recognize two identical objects in trial 1. In trial 2 (OLT), one of the objects is moved to a new corner. Time investigating the relocated object (RO) is quantified. In trial 3 (NORT), the object that was not moved in trial 2, is replaced with a novel object (NO) and time spent investigating the novel object is quantified. (E) Representative track traces from the object location task. (F) Quantification of percent investigation time of the relocated object in trial 2. (G) Representative track traces from the novel object recognition task. (H) Quantification of percent investigation time of the novel object in trial 3. (I) Quantification of the number of errors made prior to reaching the escape platform during the radial arm water maze. (J) Quantification of latency to reach the escape platform in the radial arm water maze. (K) Quantification of latency to fall from the rod during the rotarod task. MAPT KI and WT mice showed an age-related decline in rotarod performance at 12, 18, and 24 m when compared to 6 m genotype matched animals. 18 m WT mice also spent significantly less time on the rod compared to 18 m KI animals. For all histograms, individual data points are shown while bars represent mean of groups ± standard deviation. * p ≤ 0.05. # Significantly different than all other ages (p ≤ 0.05). *** Significantly different than 18 m MAPT KI and 12 m WT and MAPT KI (p ≤ 0.05) (n = 12–20 for combined sex groups).

