Figure 3.
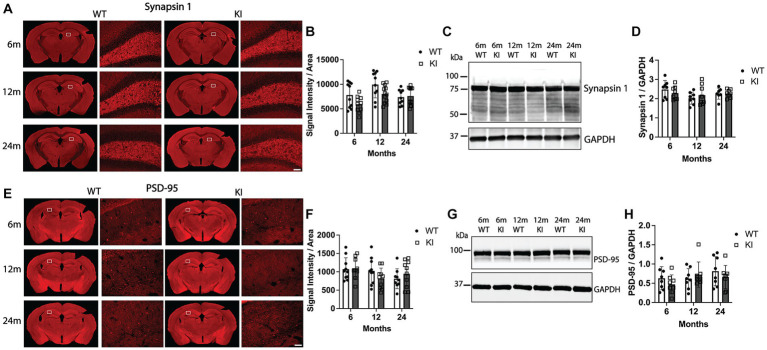
Quantification of synaptic markers in the hippocampus of MAPT KI and WT mice. Tissue from 6, 12, and 24 months old male and female human MAPT knock-in (MAPT KI or KI) and wild type (WT) mice (n = 4–5/group) was processed for immunofluorescence detection of the presynaptic marker, synapsin 1 (A,B), and the post-synaptic marker, post synaptic density 95 (PSD-95; E,F) in the hippocampus, as well as biochemical quantification of synapsin 1 (C,D) and PSD-95 (G,H) from hippocampal lysates. For all endpoints, no sex differences were detected within a given age and genotype (see Supplementary Tables S2.4A–S2.5B for data on individual sexes). Sexes were combined within age and genotype for all subsequent analyses. (A) Representative images of synapsin 1 immunofluorescence in MAPT KI and WT mice. High magnification images of synapsin 1 immunofluorescence correspond to the area within in the box in the low magnification images. (B) Quantification of synapsin 1 fluorescence intensity normalized to the area of the respective hippocampal sections. (C) Representative immunoblots of synapsin 1 and glyceraldehyde phosphate dehydrogenase (GAPDH) from hippocampal lysates. (D) Quantification of synapsin 1 normalized to GAPDH in hippocampal lysates. (E) Representative images of PSD-95 immunofluorescence in MAPT KI and WT mice. High magnification images correspond to the area within in the box in the low magnification images. (F) Quantification of PSD-95 fluorescence intensity normalized to the area of the respective hippocampal sections. (G) Representative immunoblots of PSD-95 and GAPDH from hippocampal lysates. (H) Quantification of PSD-95 normalized to GAPDH in hippocampal lysates. For all histograms, individual data points are shown while bars represent the mean of groups ± standard deviation (n = 8–10/group for combined sexes). Scale bar in the bottom right panel of (A,E) is 50 μm and applies to all high magnification images.

