Fig. 3.
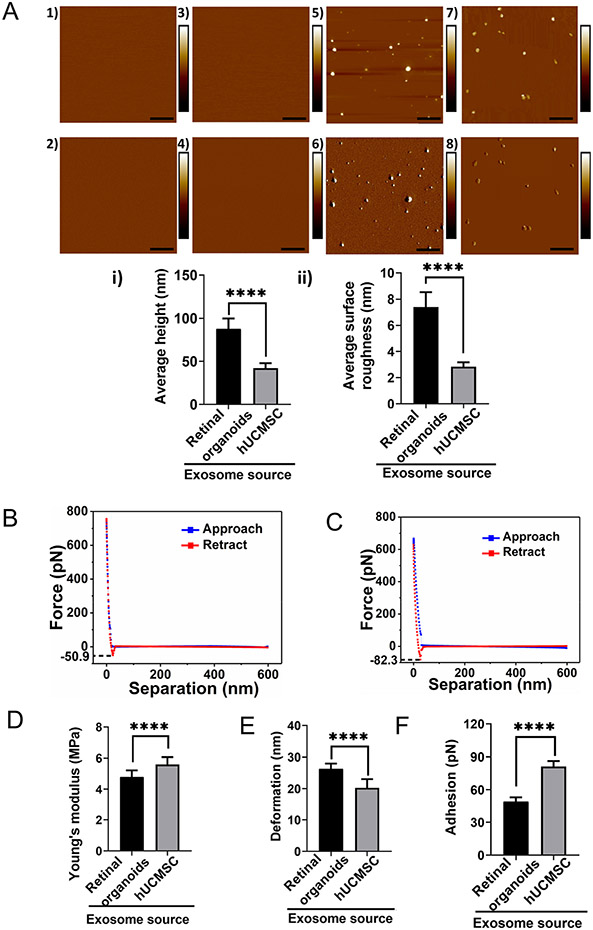
Topographical and nanomechanical characteristics of EVs. A Representative AFM images of plain mica and APTES: DIPEA modified mica (1, 3) Height image (2) Peak force error image. Representative images of retinal organoid and hUCMSC EVs (5, 7) Height image 6, 8) Peak force error image. (Scale bar: 1 μm; color bar for height image: −65 nm to 65 nm; color bar for peak force error image: −300 pN to 300 pN). Morphology quantification i) Average height ii) Average surface roughness. (Statistical significance: ****; p < 0.0001). A representative force-separation curve displaying adhesion value corresponding to exosomes derived from B Retinal organoid and C hUCMSC. Nanomechanical attributes displaying D Young’s modulus E Deformation F Adhesion. (****; p < 0.0001).

