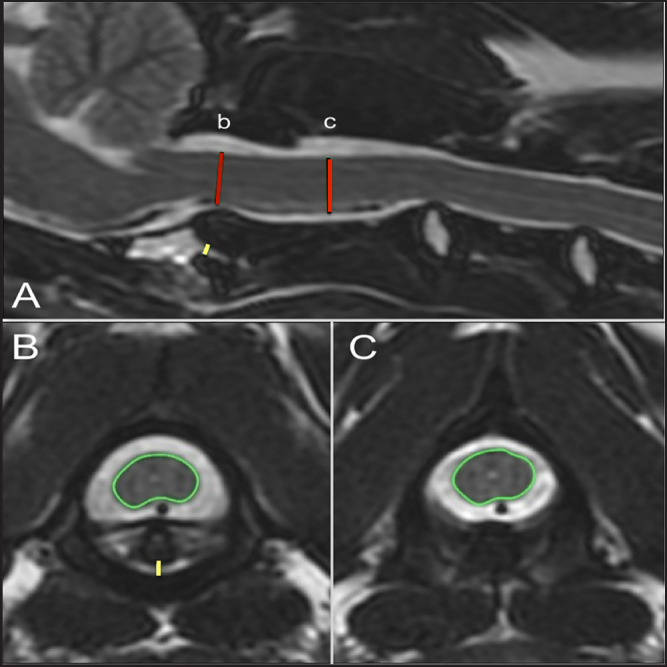
Fig. 2. T2-weighted sagittal (A) and transverse (B, C) images of a 4-year-old spayed female Maltese used as a control dog (TE, 120 ms; TR, 3800 ms; slice thickness, 2.5 mm). On the sagittal image (A), the dorsoventral diameter of the spinal cord at the level of the dens (b) and mid-body of C2 (c) has been measured (red lines), as has the distance from the ventral border of the dens to the caudal articular fovea of the atlas (yellow line). On the transverse images, the cross-sectional area of the spinal cord at the level of the dens (B) and mid-body of C2 (C) has been outlined, as has the subluxation distance from the dens to the atlas (yellow line in B).

