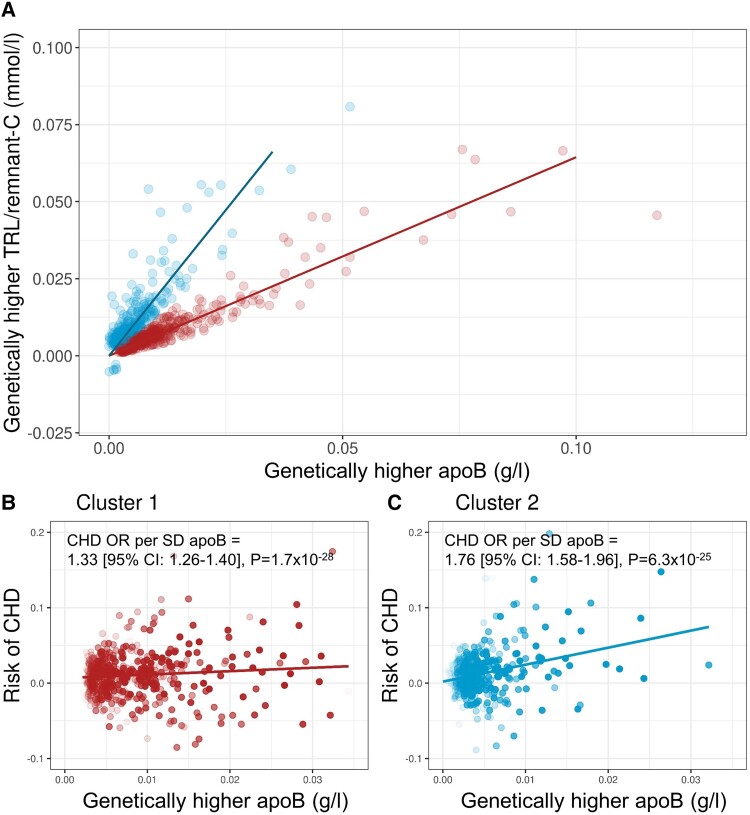
Figure 2.
Association of apoB with TRL-C and CHD risk in clusters 1 and 2. (A) Association of TRL/remnant-C with apoB in each SNP cluster with the exposure allele defined as the variant raising apoB. ApoB has units of g/L, and TRL/remnant-C has units of mmol/L. Panels (B) and (C) show, for clusters 1 and 2, respectively, each SNPs’ effect on apoB and on CHD (prevalent + incident) outcome [note that the x-axis for cluster 1 in (B) has been truncated to allow better visual comparison with the apoB range for cluster 2 in (C)]. Data points in (B) and (C) are colored as less translucent the lower the P value for apoB. Mendelian randomization modeling (inverse variance–weighted method) was used to determine the odds ratio (OR) for CHD risk per Sd change in apoB (0.23 g/L) for each cluster in the cohort of subjects off or on lipid-lowering treatment.

