Fig. 1.
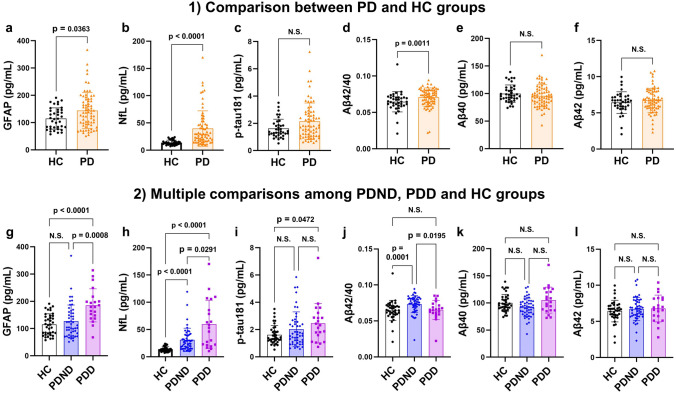
Comparison of plasma biomarker levels. 1 Comparison results between the two groups of PD and HC in plasma levels of GFAP (a), NfL (b), p-tau181 (c), Aβ42/40 (d), Aβ40 (e) and Aβ42 (f). Significance was tested using the Wilcoxon rank sum test. 2 Multiple comparison results among the three groups of HC, PDND, and PDD in plasma levels of GFAP (g), NfL (h), p-tau181 (i), Aβ42/40 (j), Aβ40 (k) and Aβ42 (l). Significance was tested with Kruskal − Wallis test followed by post hoc Steel − Dwass multiple comparison tests. PD Parkinson’s disease, HC healthy control, PDND nondemented Parkinson’s disease, PDD Parkinson’s disease dementia, GFAP glial fibrillary acidic protein, NfL neurofilament light chain, p-tau phosphorylated tau, Aβ amyloid beta, N.S. not significant

