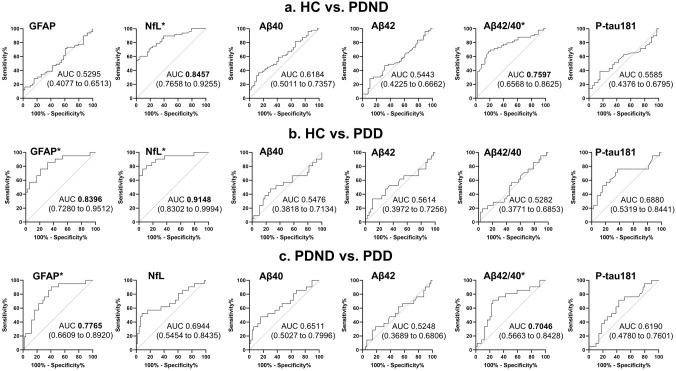
Fig. 3.
ROC analysis in the discrimination capacity of the six plasma biomarkers among groups. ROC curves and AUC for differentiation between HC and PDND (a), HC and PDD (b), PDD and PDND (c). The numbers in the brackets indicate the 95% confidence intervals for the AUC. ROC receiver operating characteristic, AUC area under the curve, GFAP glial fibrillary acidic protein, NfL neurofilament light chain, Aβ amyloid beta, p-tau phosphorylated tau, HC healthy control, PDND nondemented Parkinson’s disease, PDD Parkinson’s disease dementia. The asterisk denotes a biomarker with an acceptable or higher AUC value (> 0.7, bold letters)

