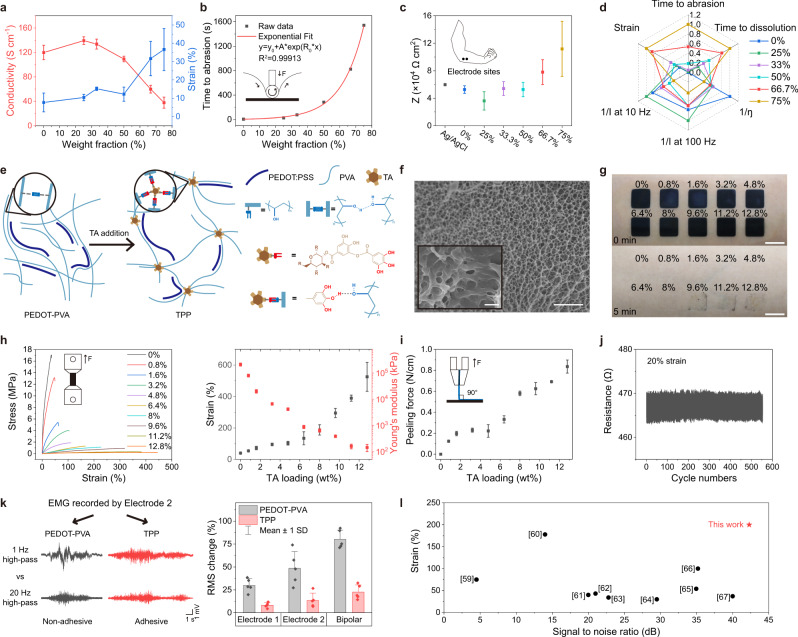
Fig. 2. Characterization of PEDOT-PVA and TPP electrodes.
a Strain and conductivity of PEDOT-PVA electrodes. b Abrasion-resistance of PEDOT-PVA electrodes. c The impedances of the Ag/AgCl electrode and PEDOT-PVA electrodes measured at 100 Hz, as recordings up to 100 Hz is commonly used for comparison of muscle activity. d The radar plot of characterization results with different PVA addition. e Schematic illustration of the working mechanism in PEDOT-PVA and TPP films and related chemical structures. After TA addition, the PVA chains are more cross-linked at the position of TA. This process expands the space between polymer chains and generates a porous structure. f The cross-sectional SEM image of TPP films with 8% TA loading, with a magnified region of interest as inset. Scale bar: 4 μm; inset: 1 μm. Micrographs (×3) were collected independently with similar results. g A photograph of residue after TPP films with different TA loading peeled off from the skin. Scale Bar: 1 cm. h Tensile stress–strain curves, strain and Young’s modulus of TPP films. i Peeling force of TPP films on the skin. j Real-time monitoring of the TPP film by stretching the film from a strain of 0 to 20% for about 500 cycles. k EMG signals recorded by PEDOT-PVA and TPP electrodes. Electrodes 1 and 2 were attached to biceps brachii for recording during the biceps curl. The raw data was filtered by 1 Hz and 20 Hz high-pass filter; RMS change between two filtered signals showed the extent of discrepancy. . l Strain and SNR comparisons between this work and electrodes in other literatures. Data in Fig. 2 are presented as mean values ± SD. For all measurements, number of samples was 3, except for Fig. 2k it was 5.

