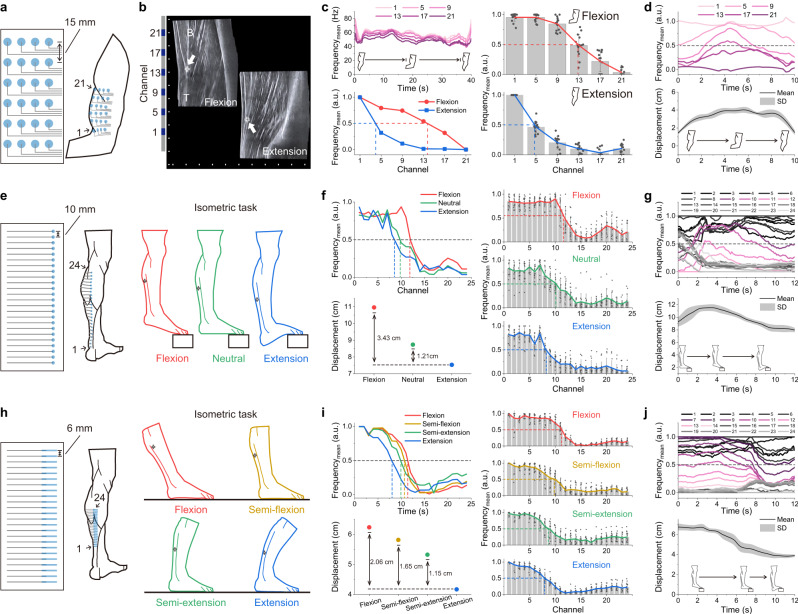
Fig. 7. Location of muscle-tendon junction by MEAP.
a Schematic diagram of a MEAP on the biceps. The IED was 15 mm. Channel numbers (1–24) were ordered from left to right and from bottom to top. b Ultrasound image of tendon displacement during the isometric task with load of 5 kg and MEAP relative position on the skin. Scale bar: 1 cm. B: biceps brachii; T: distal biceps tendon. c Mean frequencies of the EMG signals; left panels show data from the biceps brachii of a representative subject during the isometric task and the normalised mean frequencies for each channel during flexion and extension. Right panels show the normalised mean frequency data in multiple subjects. MEAPs were attached on comparable positions on the biceps brachii muscles of the subjects to obtain junction locations. d Normalised mean frequencies of the EMG signals recorded from the biceps brachii of a representative subject during the dynamic task and real-time junction displacement in multiple subjects. e, h Schematic diagrams of MEAPs on the gastrocnemius and Achilles tendon, and isometric tasks on a step and on the ground, respectively; the IEDs were 10 mm and 6 mm respectively. Channel numbers (1–24) were ordered from bottom to top. f, i Normalised mean frequencies of the EMG signals; left panels show data from the gastrocnemius and Achilles tendon of a representative subject during different isometric tasks and their corresponding displacements. Right panel shows the normalised mean frequency data in multiple subjects. MEAPs were attached on similar locations on the Achilles tendon of subjects to obtain junction locations. g, j Normalised mean frequencies of the EMG signals recorded from the gastrocnemius and Achilles tendon of a representative subject during the dynamic task and real-time junction displacement in multiple subjects. All displacements represent the distance between the first channel position and the junction position; all statistical experiments were conducted with the three repeated isometric or dynamic tasks performed by five subjects (n = 15, different MEAPs used); data are presented as mean values ± SD. a.u. arbitrary units.

