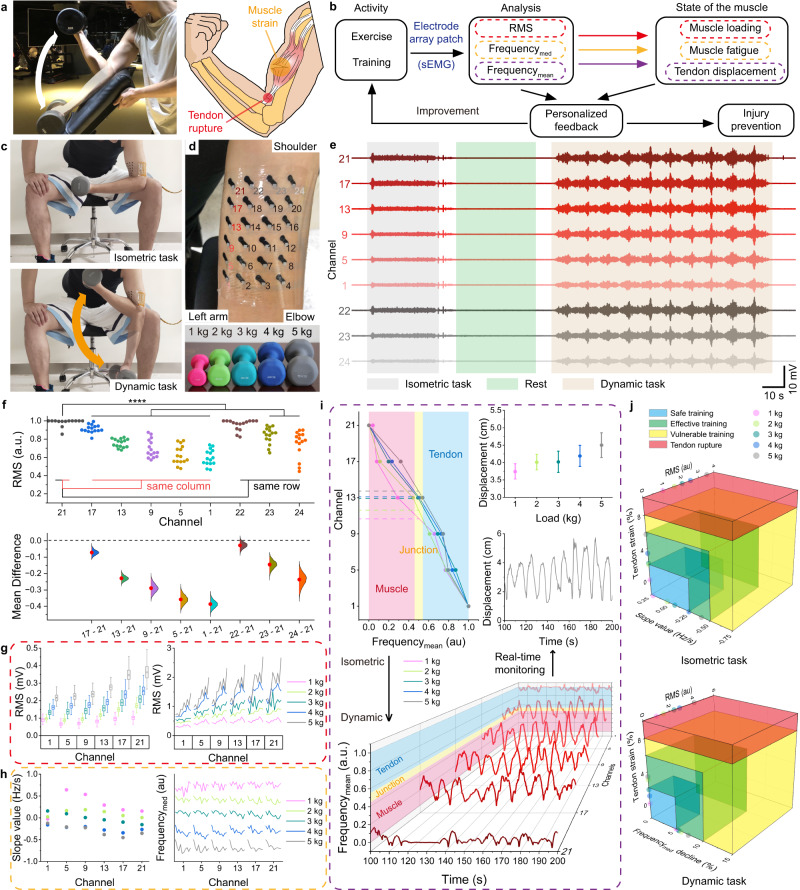
Fig. 8. High-density sEMG recording by MEAP for muscle injury prevention.
a A photograph of a biceps curl and a risk schematic. b Diagram of the injury prevention system components. c Photographs of a session including isometric and dynamic tasks. d Photographs of channel sites of MEAP and different loads. e sEMG signals in 5 kg load session. f Statistical analysis of sEMG signals recorded by MEAP on different subjects. The Gardner-Altman plot illustrates the RMS values of sEMG signals captured by MEAPs (n = 15, 3 repeated isometric tasks performed by five subjects, different MEAPs used; mean presented as red dots, 0.95 confidence interval presented as red line, and Kernel Smooth used for distributions). The RMS values are normalised to their respective maximum values, and channel 21 (control) is compared with others. Significance was determined by one-side t test (*P < 0.05; **P < 0.01; ***P < 0.001; ****P < 0.0001). g RMS values of sEMG signals in the isometric task (left) and in the dynamic task (right) across selected channels (n = 54 RMS values per channel). The box plots show the mean (centre square), median (centre line), the 25th to 75th percentiles (box) and the smallest and largest value that is ≤1.5 times the interquartile range (the limits of the lower and upper whiskers, respectively). h Median frequency details of sEMG signals recorded by MEAPs. Linear fit slopes for median frequencies in the isometric task (left) and changes of median frequencies in the dynamic task (right) across select channels are shown. i Top left, plot of normalised value of mean frequencies among six channels in the isometric task; top right, plot of tendon displacements in the isometric task (n = 3 repetitive tasks for each measurement); bottom, plot of normalised values of mean frequencies among six channels in the dynamic task; middle right, plot of real-time monitoring of the tendon displacement in the dynamic task. j A visual representation of the potential for muscle injury index, generated based on the assessments made using the MEAP. The assessment is presented as a unified model using the measures obtained from (g–i).

