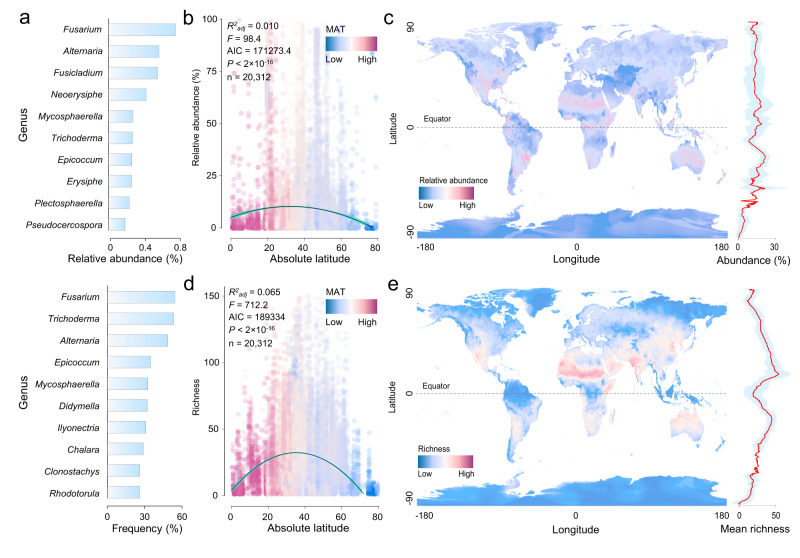
Fig. 2. Global biogeography and diversity patterns of potential phytopathogenic fungi.
a Top ten most abundant (top) and frequently occurring (bottom) phytopathogenic fungal genera across 20,312 samples. b Latitudinal distribution of relative abundance of phytopathogenic fungi. Colours represent the annual mean air temperatures (MAT) of sampled locations. The line shows the second-order polynomial fit based on ordinary least squares regression. Shaded areas represent the 95% confidence intervals. The analysis was based on one-side F and two-side t tests (model parameters and P values are reported as inset panels). n represents the number of samples. c Global relative abundance of phytopathogenic fungi. The relative abundance of phytopathogenic fungi was predicted using GLMs incorporating 19 bioclimatic variables, with the prediction efficiency cross-validated (CV) by common Pearson correlation test using 2/3 samples as a model training dataset and 1/3 as a validation dataset (CV: Pearson r = 0.249, P < 2 × 10⁻¹⁶, Supplementary Fig. 2a). Climate variables are derived from WorldClim2 at a 5 min resolution (~10 km). The righthand panel shows the mean (with standard deviation envelope) relative abundance of phytopathogenic fungi across latitudes. d Latitudinal distribution of phytopathogenic fungal species richness. The line shows the second-order polynomial fit based on ordinary least squares regression, and shaded areas represent the 95% confidence intervals. The analysis was based on one-side F and two-side t tests (model parameters and P values are reported as inset panels). n represents the number of samples. e Global diversity of phytopathogenic fungi. The global distribution of phytopathogenic fungal species richness was also cross-validated (CV: Pearson r = 0.429, P < 2 × 10⁻¹⁶, Supplementary Fig. 3). The righthand panel shows the mean (with standard deviation envelope) phytopathogenic fungal species richness across latitudes, with peaks in richness at intermediate latitudes. The maps were generated in the R language. Source data are provided as a Source Data file.

