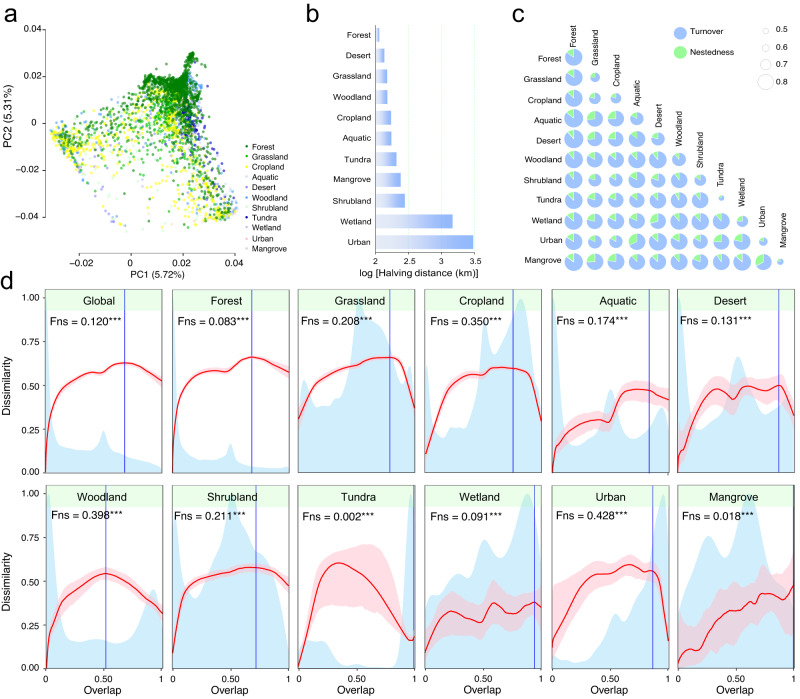
Fig. 3. Community turnover and universal dynamics of potential phytopathogenic fungi.
a Principal co-ordinates analysis (PCoA) of phytopathogenic fungal communities based on Bray–Curtis dissimilarity. Samples are coloured by land cover type. b Halving distance of phytopathogenic fungal community across land cover types. Halving distance is the geographic distance between samples at which community similarity halves (see “Methods” section). c Species turnover and nestedness of phytopathogenic fungal communities across land cover types. Circle sizes reflect total beta diversity (measured by Sørensen’s distance), with light blue and red colours respectively showing the relative contribution of turnover and nestedness to total community variation. d Universal ecological dynamics of phytopathogenic fungi. The ecological universality of phytopathogenic fungi was assessed using dissimilarity-overlap curves. Dissimilarity-overlap curves are in red, the distribution density of sample pair overlap is in light blue, and the point at which the curve first becomes negative is marked by a vertical blue line (chosen by median of 1000 bootstraps). The pink shared area indicates the range of the 94% confidence intervals. The fraction of negative slope (Fns) is the fraction of data points where the dissimilarity-overlap curve has a negative slope (***P < 0.001). A higher Fns value indicates that the underlying ecological dynamics of a microbiome are largely host-independent. Source data are provided as a Source Data file.

