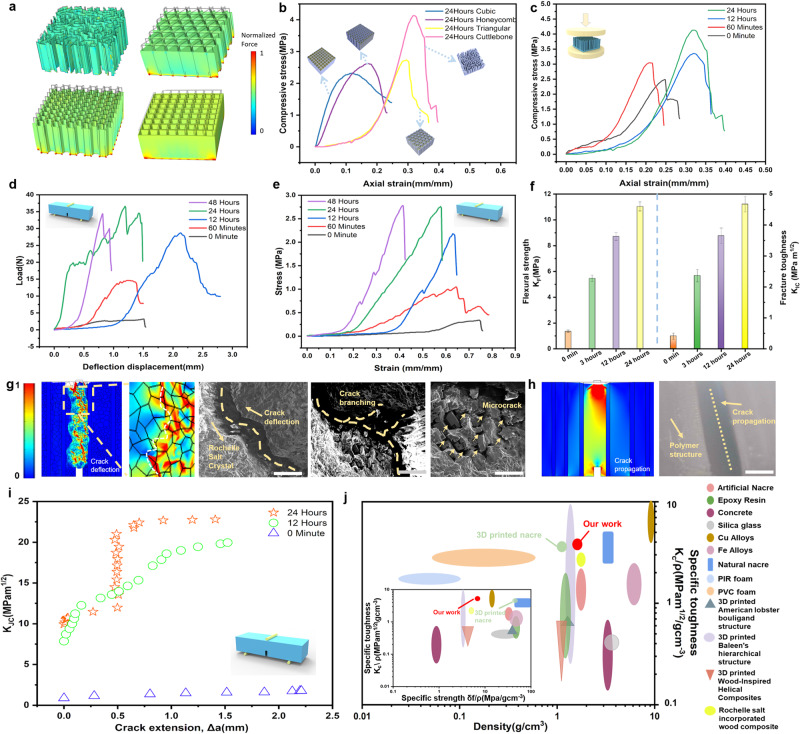
Fig. 3. Studies of mechanical properties of 3D-printed-RSC.
a FEM simulation of the compressive load of four different structures; b Comparison of compressibility of RS crystal growth in various structures for 24 h; c Comparison of compression properties of different RS crystal growth time inside the 3D-printed cuttlebone structure; d Compression force versus resistance change for various RS crystal growth time inside the 3D-printed cuttlebone structures; e Comparison of stress versus strain of the 3D-printed cuttlebone structures with different RS crystal growth time; f Comparison of fracture strength (KF) and fracture toughness for crack initiation (KIC) of the 3D-printed cuttlebone with different RS crystal growth time. Error bars represent standard deviation (n = 10); Simulations of stress distribution by COMSOL Multiphysics for the 3D-printed-RSC (g) (inset shows SEM images of the related fracture surfaces, scale bar from left to right, 400 µm, 400 µm, 150 µm) and 3D-printed cuttlebone (h) (inset shows microscope photo of the related fracture surface, scale bar 500 µm); i R-curves of the 3D-printed-RSC for different growth time; j Comparison of specific toughness and density of the 3D-printed-RSC with other works (inset shows the comparison of specific strength and specific toughness of the 3D printed-RSC with other works)21,26,38,43,54–63.

