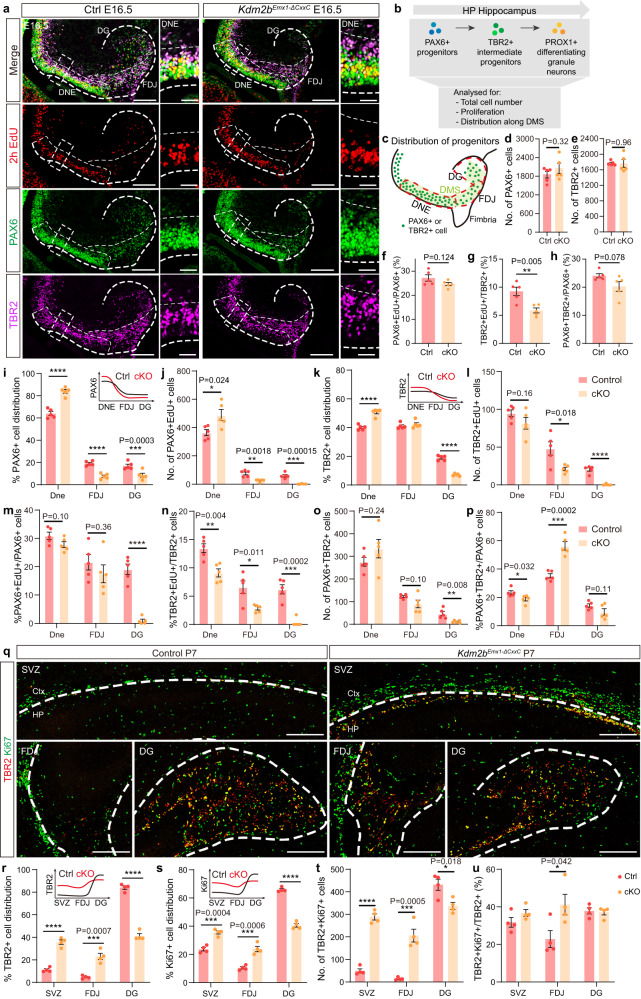
Fig. 4. Blocked differentiation of neural progenitors on loss of KDM2B-CxxC.
a Triple-labeling of PAX6 (green), TBR2 (violet) and EdU (red, labeled 2 h) on E16.5 control and Kdm2bEmx1-ΔCxxC brain sections. Boxed regions were enlarged on the right, and single channel fluorescence images of PAX6, TBR2 and EdU were shown respectively. Dashed lines outline the hippocampi and distinguish DNE, FDJ and DG. b Experimental analysis scheme. The cartoon in Fig. 4b is adapted from Caramello et al.36. c The schematic of E16.5 wild-type hippocampi. Green dots represent PAX6+ progenitors or migrating TBR2+ intermediate progenitors. d, e Quantification of total PAX6+ and TBR2+ cells. f–h Quantification of the proportion of PAX6+EdU+/PAX6+ (f), TBR2+EdU+/TBR2+ (g) and PAX6 + TBR2+/PAX6+ (h). i–p Quantification of the distribution of PAX6+ (i), PAX6+EdU+ (j), TBR2+ (k), TBR2+EdU+ (l) and PAX6 + TBR2+ cells (o), and quantification of the proportion of PAX6+EdU+/PAX6+ (m), TBR2+EdU+/TBR2+ (n) and PAX6 + TBR2+/PAX6+ (p) along the DMS. The distribution patterns of PAX6+ (i) and TBR2+ (k) cells in control and cKO hippocampi were shown as line graphs on the upper right corners. q Double-labeling of TBR2 (red) and Ki67 (green) on P7 coronal section of control and Kdm2bEmx1-ΔCxxC SVZ, FDJ and DG. Dashed lines outline the hippocampi. Immunofluorescence staining of whole brain sections were shown in Supplementary Fig. 7a. r–u Quantification of the distribution of TBR2+ (r), Ki67+ (s) and TBR2 + Ki67+ cells (t), and the proportion of TBR2 + Ki67+/TBR2+ (u) at SVZ, FDJ and DG. n = 5 for control brains and n = 5 for Kdm2bEmx1-ΔCxxC brains (d–p). n = 4 for control brains and n = 4 for Kdm2bEmx1-ΔCxxC brains (r–u). Data are represented as means ± SEM. Statistical significance was determined using an unpaired two-tailed Student’s t-test (d–h), or using two-way ANOVA followed by Sidak’s multiple comparisons test (i–p, r–u). *P < 0.05, **P < 0.01, ***P < 0.001, and ****P < 0.0001. Scale bars, 200 μm (a left, q), 50 μm (a right). DNE dentate neuroepithelium, FDJ fimbriodentate junction, DG Dentate Gyrus, SVZ subependymal ventricular zone, Ctx Cortex, HP Hippocampus.

