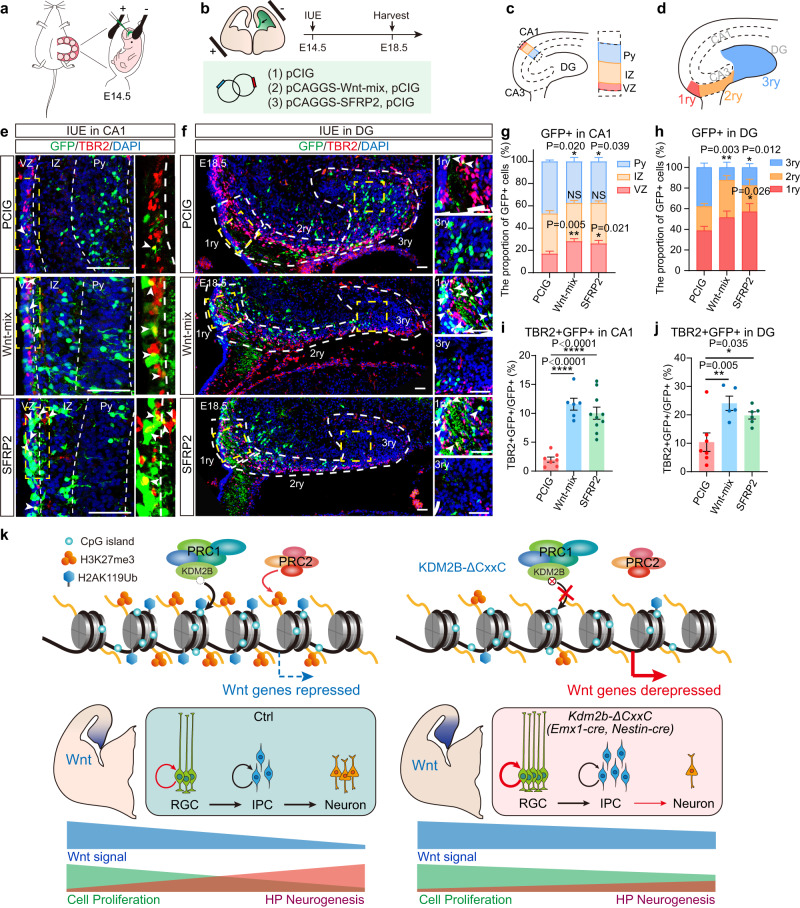
Fig. 7. Aberrant activation of the Wnt signaling in blocks hippocampal neurogenesis.
a, b The schematic diagram of in utero electroporation (IUE) to target the developing hippocampi. E14.5 mouse hippocampi were electroporated with empty or Wnt-mix-expressing vector (Wnt3a, Wnt5a, Wnt5b, Wnt7b, and Wnt8b) or SFRP2-expressing vector, along with the GFP-expressing vector (PCIG) to label transduced cells. Embryos were sacrificed at E18.5 for immunofluorescent analysis. c, d The schematic diagram of hippocampal structure, and the hierarchical partition of CA1 (VZ, IZ, Py) (c) and DG (1ry, 2ry, 3ry) (d). e, f Representative immunofluorescent images showing expression of TBR2+ (red) in GFP+ (green) transduced cells at E18.5 CA1 regions. Arrowheads denote double-labeled cells. White dashed lines distinguish three layers of CA1: VZ, IZ, Py in (e) and 1ry, 2ry, 3ry of DG (f). g, h The relative location of GFP+ cells in VZ, IZ, Py (g) and 1ry, 2ry, 3ry (h) were quantified. i, j Quantification of the proportion of TBR2 + GFP + /GFP+ in CA1(i) or in DG (j) of PCIG, Wnt-mix and SFRP2. k Schematic diagram of KDM2B on hippocampal development: Loss of KDM2B-CxxC reduces repressive histone modifications—H2AK119ub and H3K27me3—on key Wnt signal genes, hence leading to prolonged Wnt activation over time. Hampered differentiation and migration of hippocampal progenitors leads to hippocampal hypoplasia. n = 7 for PCIG brains, n = 6 for Wnt-mix brains and n = 10 for SFRP2 brains in (g, i). n = 7 for PCIG brains, n = 5 for Wnt-mix brains and n = 6 for SFRP2 brains in (h, j). Data are represented as means ± SEM. Statistical significance was determined using two-way ANOVA followed by Tukey’s multiple comparisons test (g, h), or using one-way ANOVA analysis (i, j). *P < 0.05, **P < 0.01, ***P < 0.001, and ****P < 0.0001. Scale bars, 50 μm (e, f). CA Cornu Ammonis, VZ ventricular zone, IZ intermediated zone, Py pyramidal cell layer of the hippocampus.

