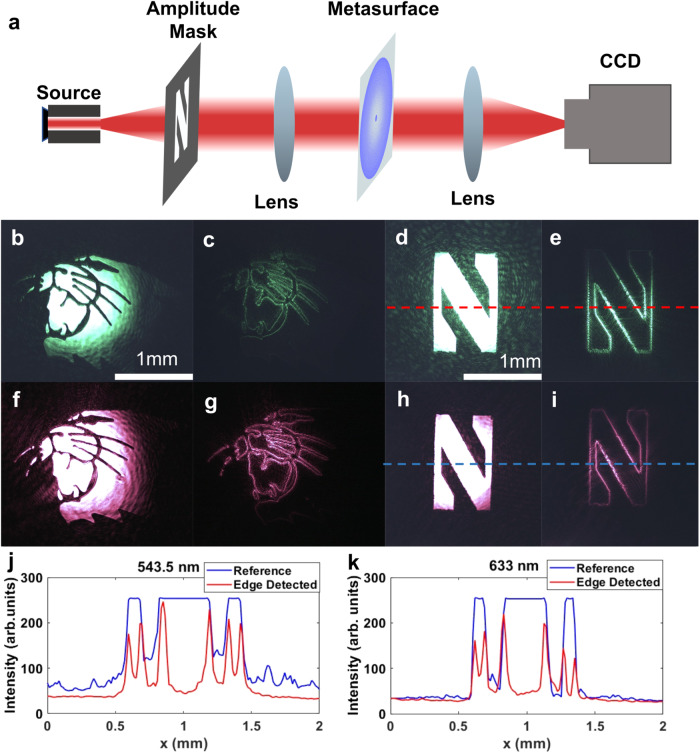
Fig. 4. Edge-detection experiments with Red and Green HeNe laser sources.
a The schematic of the experimental setup for imaging and edge detection experiments. b–e Experiments at 543.5 nm wavelength (illuminated with XYZ green laser). b, d The reference (no metasurface) and (c, e) edge detected (with metasurface) images of (b, c) the Northwestern Wildcats logo and (d, e) the letter “N” of Northwestern University logo. f–i Experiments at 633 nm wavelength (illuminated with HeNe red laser). f, h The reference (no metasurface) and (g, i) edge detected (with metasurface) images of (f, g) the Northwestern Wildcats logo and (f, h) the letter “N” of Northwestern University logo. j, k The horizontal cuts of the images under (j) green and (k) red laser illumination. The dashed lines in (d), (e), (h), and (i) mark the location of the horizontal cuts.

