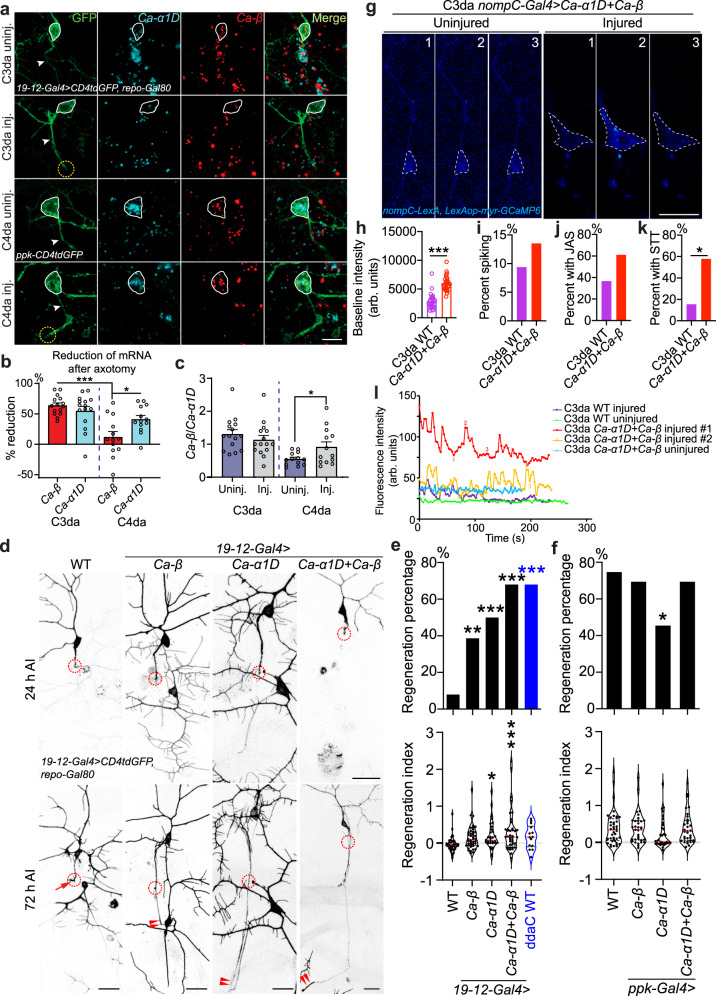
Fig. 2. The ratio of Ca-β/Ca-α1D is essential for axon regeneration.
a–c Expression analysis of Ca-α1D and Ca-β by RNAscope. a Without injury, Ca-α1D is highly expressed in C4da but low in C3da neurons, while Ca-β is similarly expressed in both cell types. After axotomy, in C3da neurons, both Ca-α1D and Ca-β are reduced. In C4da neurons, Ca-α1D is reduced but a significant level remains, whereas Ca-β remains unchanged. The cell body is outlined with the white circle and the dashed circle marks the injury site. Arrowhead marks the axon. b The percent of reduction for Ca-α1D and Ca-β after injury. Ca-β in C4da neurons show minimal reduction. N = 15 neurons, P = < 0.0001, 0.0198, average values and standard error of the means are shown. c The ratio of Ca-β/Ca-α1D with or without injury. N = 15, 15, 13, 13 neurons, P = 0.0100, average values and standard error of the means are shown. d C3da neuron overexpression of Ca-β and/or Ca-α1D increases axon regeneration. The injury site is demarcated by the dashed circle. Arrow marks axon stalling while arrowheads show the regrowing axon tips. e, f Quantifications of C3da (e) and C4da neuron (f) axon regeneration with regeneration percentage and regeneration index. N = 38, 51, 30, 38, 25 neurons, P = 0.0048, 0.0002, <0.0001, <0.0001 (top) (e) and 40, 33, 35, 33 neurons, P = 0.7926, 0.0168, 0.7926 (top) (f). g–l C3da neurons overexpressing Ca-α1D and Ca-β show elevated Ca2+ baseline and frequent subthreshold transients (STT) after axonal injury. Images from three timepoints (1, 2 and 3 shown in (l)) are presented. The dashed white circle marks the cell body. h C3da neurons with Ca-α1D + Ca-β overexpression show elevated baseline intensity than WT. N = 25, 28 neurons, P = < 0.0001. i C3da neurons with Ca-α1D + Ca-β overexpression do not show increased Ca2+ spiking in neurons without movement. N = 32, 37 neurons, P = 0.7160. j C3da neurons with Ca-α1D + Ca-β overexpression show a trend of increased percent of jittering neurons with Ca2+ spikes (JAS). N = 30, 18 neurons, P = 0.1380. k C3da neurons with Ca-α1D + Ca-β overexpression show increased percent of neurons with subthreshold Ca2+ transients (STT). N = 13, 26 neurons, P = 0.0173. l Plots of the mean fluorescence intensity over time in the cell body. *P < 0.05, **P < 0.01, ***P < 0.001, Fisher’s exact test, two-sided (e top, f top, i, j), unpaired Student’s t test, two-tailed (c, h, k), one-way ANOVA followed by Tukey’s test (b), Holm–Sidak’s test (e bottom and f bottom). Scale bar = 20 µm. Source data are provided as a Source data file.

