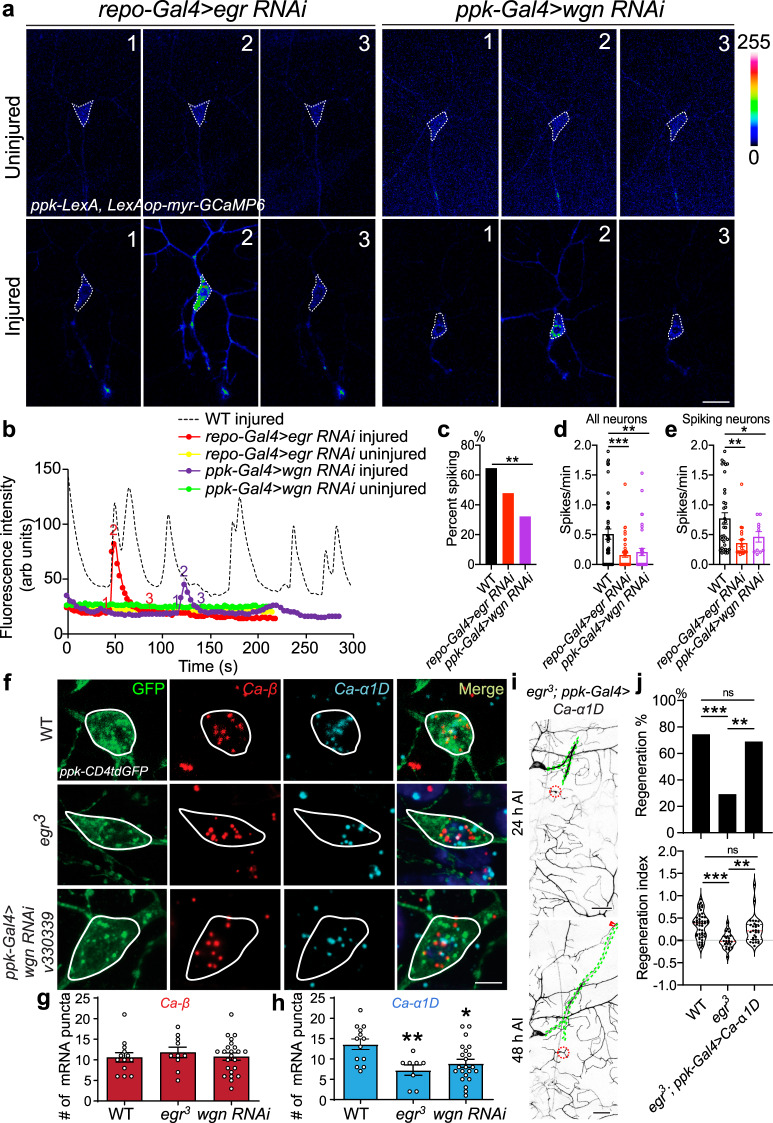
Fig. 4. Glia-neuron egr-wgn signaling is required for axotomy-induced Ca2+ transients and for maintaining Ca-α1D expression after injury.
a LoF of egr by glial RNAi or LoF of wgn by C4d neuron-specific RNAi reduces Ca2+ spikes after axonal injury. Images from three timepoints are presented. The dashed white circle marks the cell body. No obvious difference is observed in the uninjured condition. b Plots of the mean fluorescence intensity over time in the cell body. c Quantification of the percent of neurons showing Ca2+ spikes. N = 48, 46, 31 neurons, P = 0.1451, 0.0061. d, e Quantification of the number of Ca2+ spikes per minute in all neurons (d, N = 35, 48, 38 neurons, P = 0.0003, 0.0019), or spiking neurons (e, N = 35, 21, 10 neurons, P = 0.0010, 0.0442), average values and standard error of the means are shown. f Expression analysis of Ca-α1D and Ca-β in injured neurons after egr-wgn LoF. In egr3 mutants or C4da neuron-specific wgn RNAi, Ca-β levels are not altered, whereas Ca-α1D expression is significantly reduced. The cell body is outlined with the white circle. g, h Quantification of Ca-α1D and Ca-β expression levels. N = 13, 10, 23 neurons, P = 0.7776, 0.9926 and N = 13, 8, 22 neurons, P = 0.0092, 0.0138, average values and standard error of the means are shown. i, j Overexpression of Ca-α1D in C4da neurons rescues regeneration in egr3 mutants. The injury site is demarcated by the red dashed circle, and axons are traced by a green dashed line. Arrowheads show the regrowing axon tip. N = 48, 24, 29, P = 0.6115, 0.003, 0.0058 (top). *P < 0.05, **P < 0.01, ***P < 0.001, Fisher’s exact test, two-sided (c, j top), one-way ANOVA followed by Holm–Sidak’s test (d, e) or Tukey’s test (g, h, j bottom). Scale bar = 20 µm (a) and 10 µm (f). Source data are provided as a Source data file.

