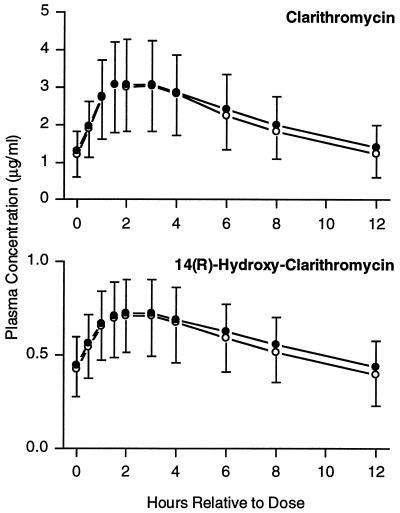
FIG. 1.
Mean steady-state clarithromycin and 14(R)-hydroxy-clarithromycin plasma concentration-time profiles following administration of clarithromycin alone or in combination with loratadine. Open circles, clarithromycin alone; filled circles, clarithromycin with loratadine. Error bars each represent 1 standard deviation.

